XRP Double Bottom Pattern Fuels Case for Rally Into Two Digits
06-Sep-2025
The Crypto Basic
A market strategist has identified a multi-year double bottom structure on the XRP chart, strengthening the case for a push to double digits.
While XRP continues to battle the bears under the $3 price mark amid broader market uncertainty, analyst EGRAG believes the token could prevail in the long run. For context, XRP dropped 25% from its July peak of $3.65 to around $2.7 earlier this month.
EGRAG Is Convinced XRP Will Reach Double Digits
Despite having recovered from this low, it still trades below the $3 region, currently changing hands at $2.82. While most analysts believe XRP is capable of recovering from this bearish spell, some like Crypto Rover suggest its next upward push could only reach levels such as $4, which could mark its top.
However, EGRAG disagrees with this idea. According to him, if XRP ever recovers from this bearish price action to surpass the previous $3.66 peak, its target for this cycle would be much higher than $4. EGRAG believes it is either $3.66 already marked the cycle top, or XRP still has the potential to reach levels between $22 and $27.
Double Bottom Pattern Strengthens this Conviction
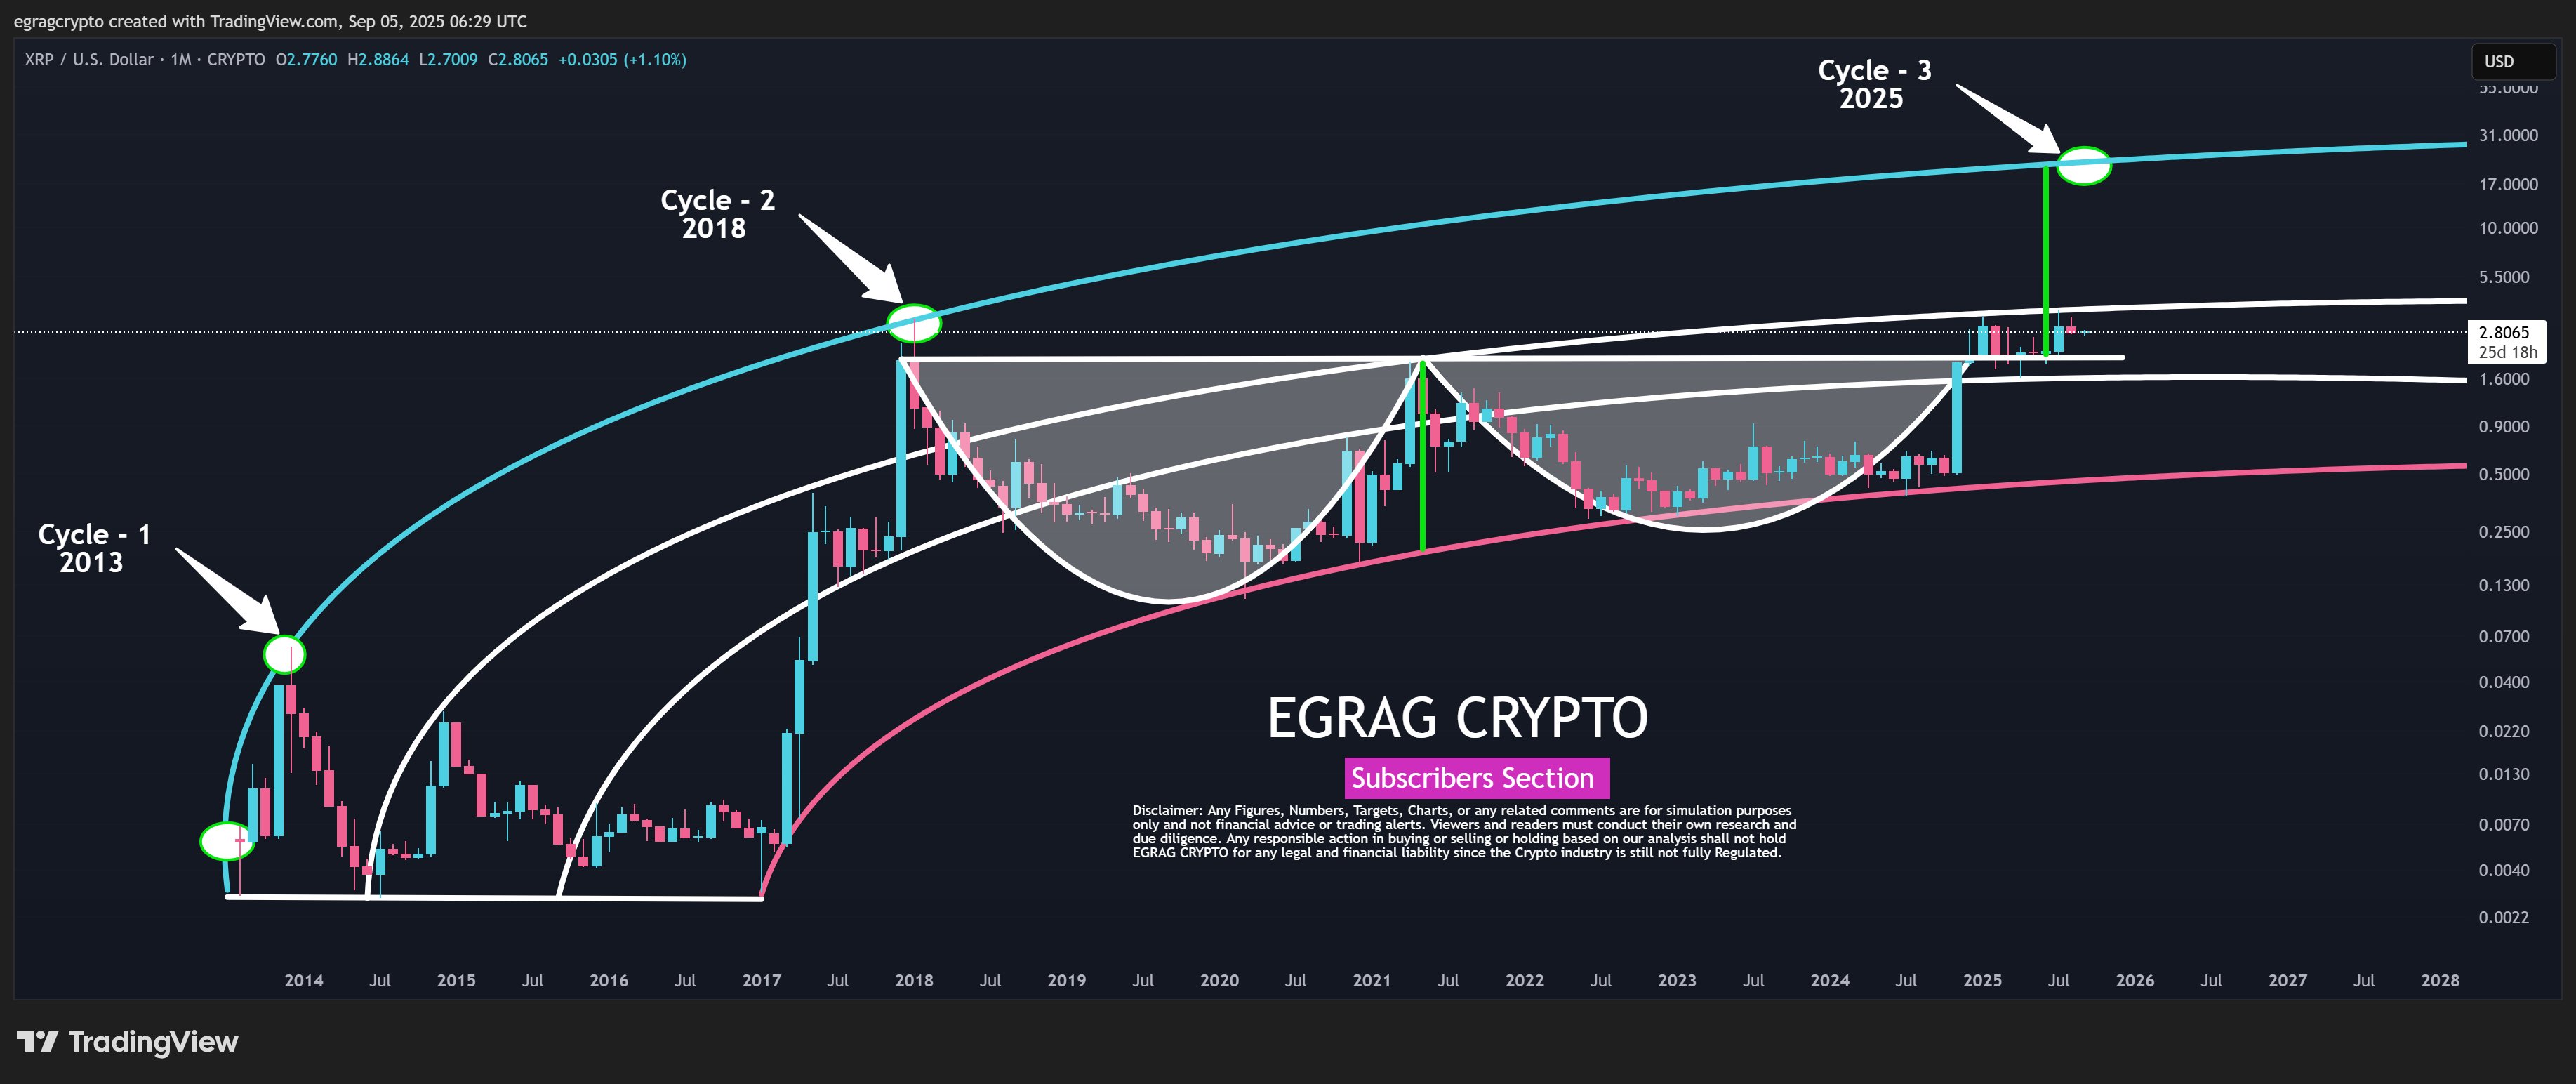
Now, in his latest analysis, he presented another technical pattern that strengthens the case for an XRP rally toward the $22 region. Specifically, XRP appears to have already broken out of a multi-year double bottom formation that began as far back as 2018.
For the uninitiated, a double bottom structure typically occurs when an asset collapses to a local bottom, recovers from this initial bottom, and then drops to a low level similar to the initial bottom before eventually rebounding to higher levels.
With XRP, the formation of the pattern began in early 2018. According to data from EGRAG's chart, XRP formed the first bottom when it slumped from the $3.31 peak in January 2018 to a floor price of $0.1140 in March 2020 before recovering to a high of $1.9669 by April 2021.
XRP Double Bottom Structure | EGRAG Crypto
Meanwhile, the second bottom structure materialized as XRP dropped from the $1.9669 peak in April 2021 to a low of $0.2870 in June 2022 on the back of the Terra ecosystem implosion, and then rebounded to the $1.95 high by November 2024 amid the broader market uptrend triggered by the U.S. elections.
These price movements essentially formed the double bottom structure, with the neckline sitting around $1.95 to $2. XRP eventually broke above the neckline when it soared past $2 in December 2024. This push helped validate the structure, setting the stage for greater heights.
XRP Eyeing $22 to $27 Target
However, since January 2025, XRP's price action has failed to push forward, forming a months-long parallel channel between $2 and $3.6. EGRAG's chart points out that once XRP breaks above this channel, a rally to higher levels could emerge. The analyst sets the same $22 to $27 target for this imminent break.
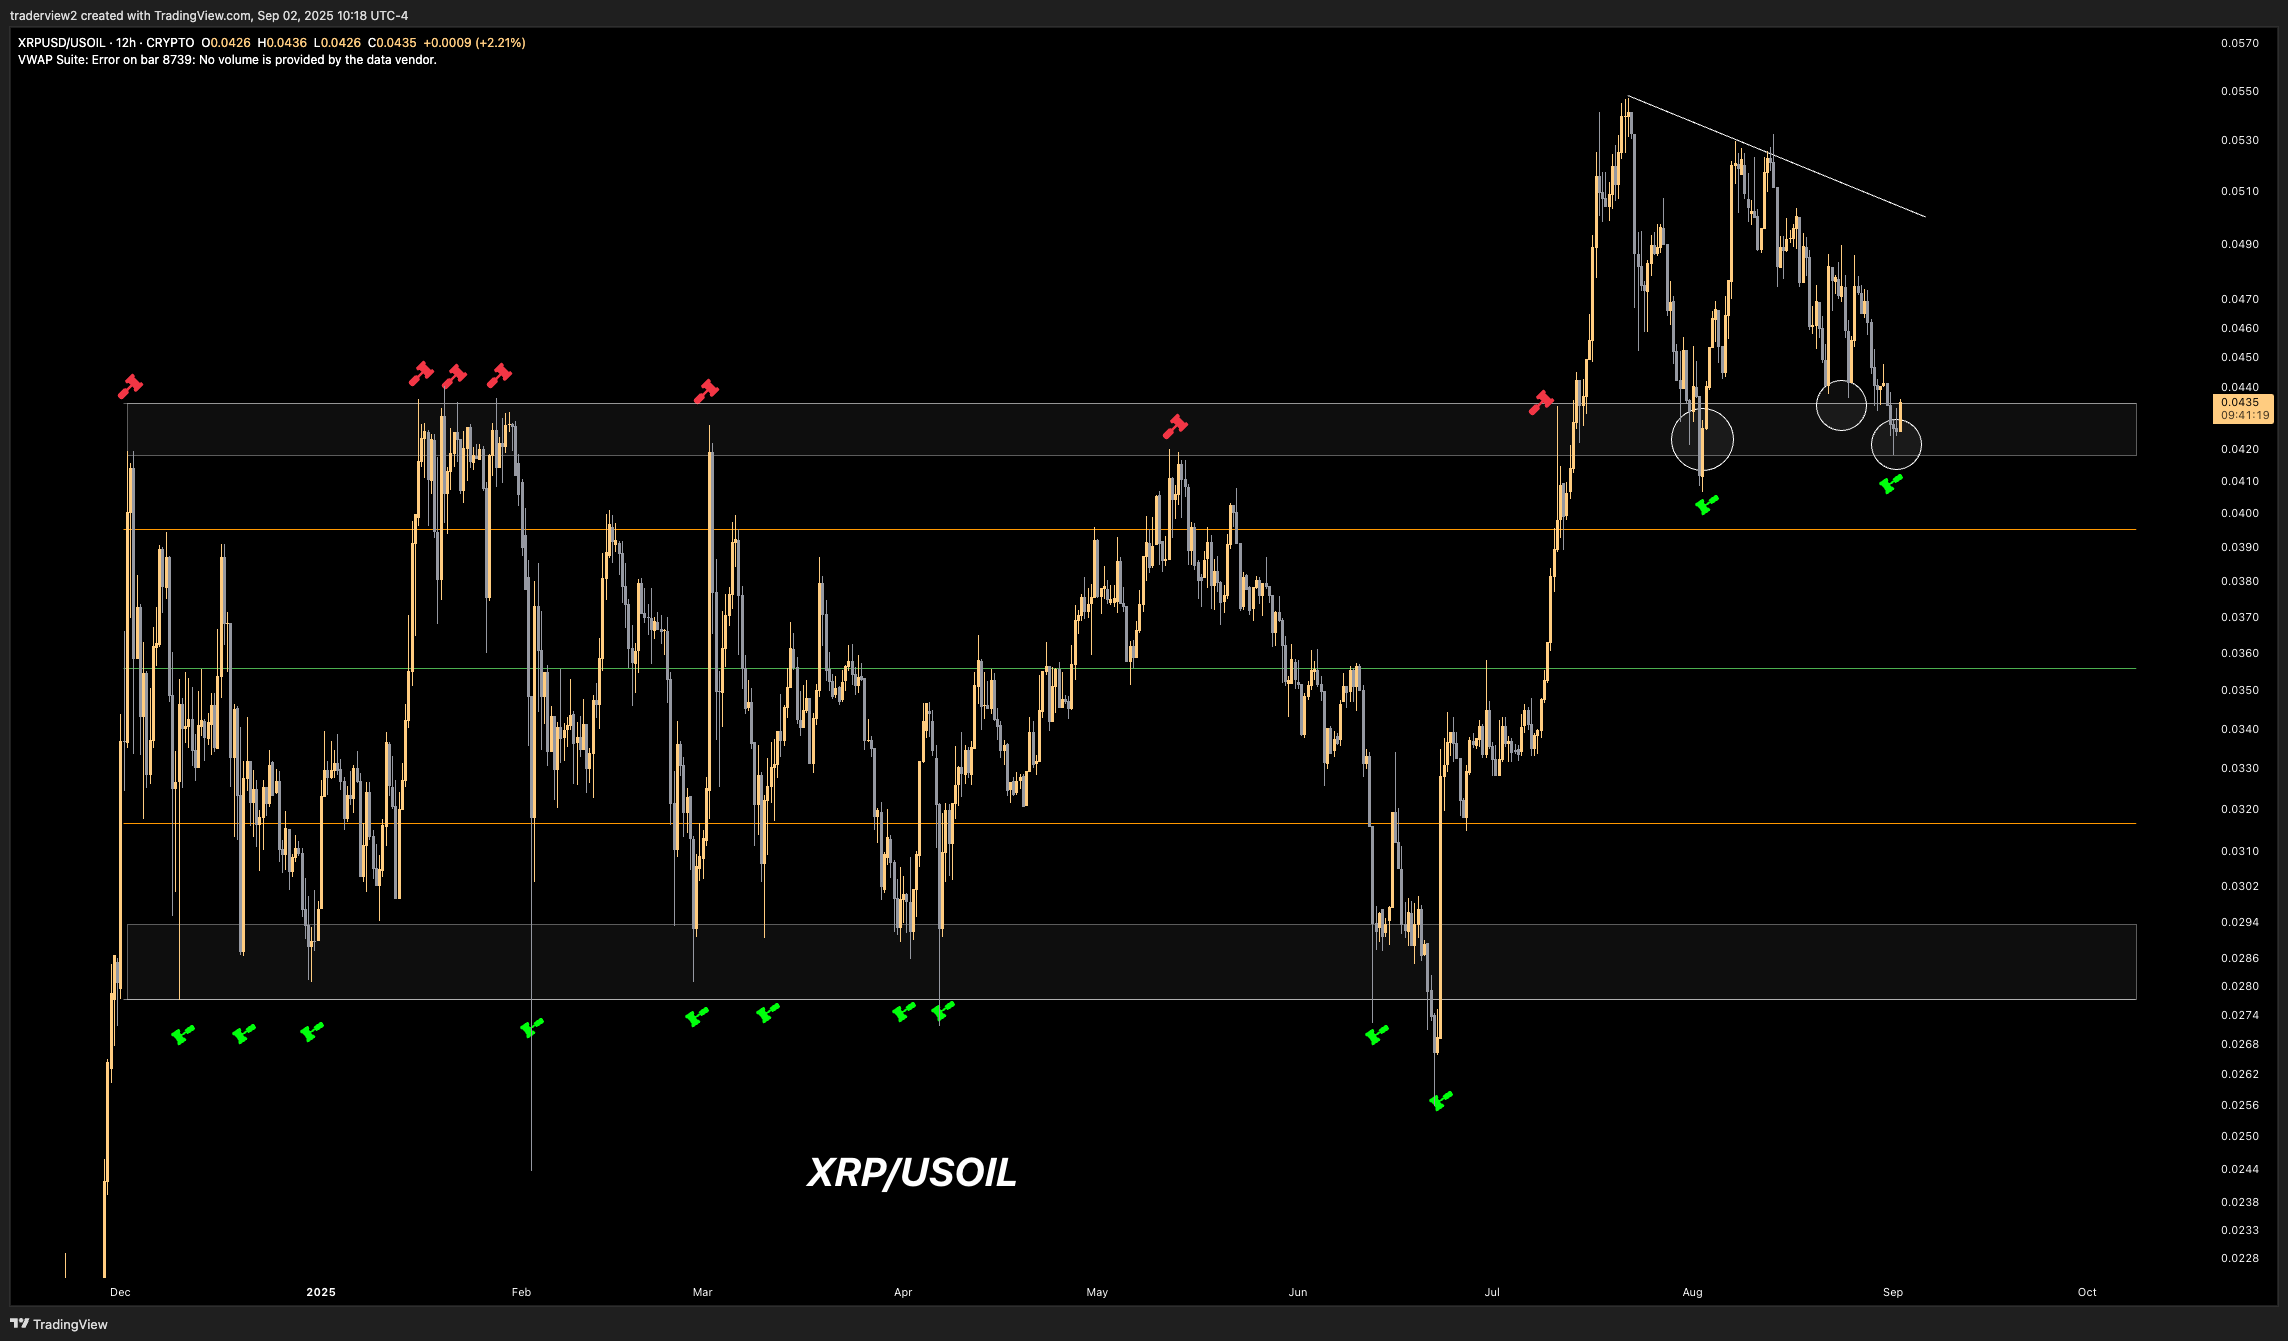
Meanwhile, in the short term, market watcher Dom recently sounded a warning while analyzing the XRP/USOIL chart. According to him, XRP is currently hanging by a thread, and the bulls need to step in; otherwise, it could drop to 7-month lows.
XRPUSOIL Chart | Dom