
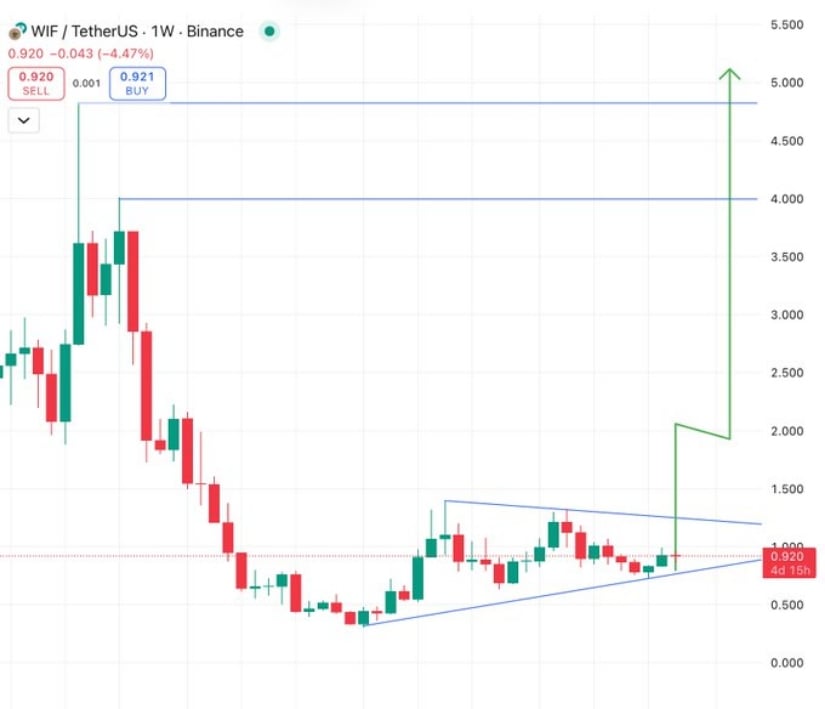
A symmetrical triangle formation visible on higher-timeframe charts underlines the possibility of an extended move, with price projections suggesting targets as high as $5 once resistance is breached. At the time of writing, the token trades near $0.91 after recent volatility.
The weekly chart for WIF outlines a classic symmetrical triangle pattern, where price movement has been compressing between converging trendlines. This type of formation is often a precursor to significant breakouts, and the setup here highlights a bullish bias if the upper resistance line is cleared.
The narrowing range shows that buyers and sellers are reaching an equilibrium, with accumulation signaling the potential for renewed upward momentum.
Source: X
The technical structure suggests that a decisive close above the resistance trendline could propel the price into a strong rally. Targets identified within the formation point toward $4 initially, with the longer-term projection stretching to $5, representing a substantial upside from current levels.
The weekly timeframe adds weight to this analysis, filtering out short-term noise and confirming that market pressure has been gradually shifting toward buyers.
Market data shows WIF trading close to $0.93 with a 4.58% gain in the last 24 hours, indicating fresh buying interest. Market capitalization currently stands near $924 million, supported by strong liquidity with daily volumes reaching about $262 million. This level of participation suggests that buyers remain engaged, with steady inflows cushioning recent volatility.
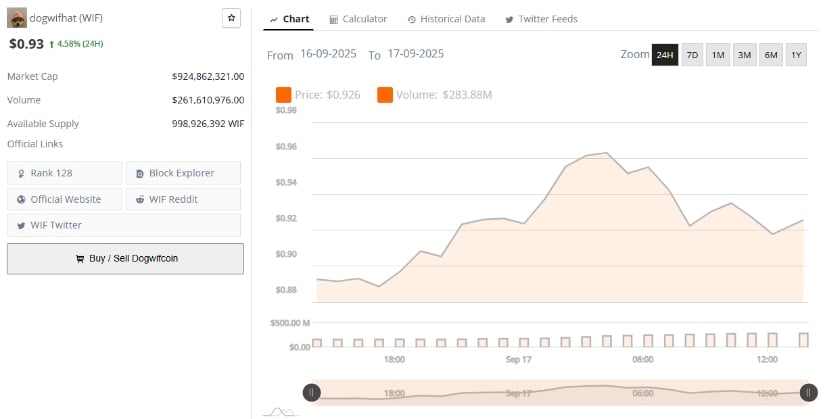
Source: BraveNewCoin
The circulating supply of approximately 999 million tokens plays an important role in price dynamics, as the limited availability amplifies the impact of demand surges. The $0.90 to $1.00 range has emerged as a critical battleground between buyers and sellers, and maintaining strength above this zone would position the asset for a push toward higher resistance levels.
If momentum continues to build, projections in the $4 to $5 zone could come into play, aligning with broader technical expectations. Conversely, a failure to defend the consolidation range may delay upward continuation, but the market’s liquidity profile and trading behavior suggest that the medium-term outlook remains supportive.
On the daily chart, WIF is trading around $0.91 after a 5.57% decline, yet the technical backdrop remains constructive. The price has historically ranged between $0.30 and $1.39, and the latest consolidation continues to respect these long-term boundaries.
Analysts have highlighted that breaking above the $1.39 level could act as the trigger for a strong continuation rally, with bullish targets well beyond current trading levels.
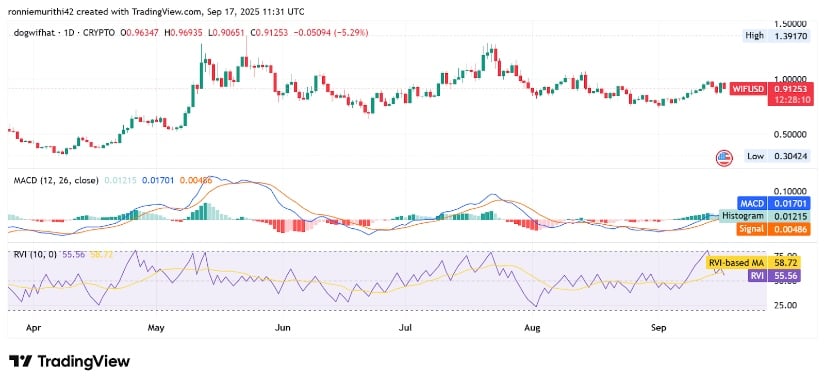
Source: TradingView
Momentum indicators back this setup. The MACD line remains above the signal line, with a positive histogram reading of 0.01198 that points toward strengthening buying momentum despite short-term pullbacks.
The Relative Volatility Index (RVI) is holding near 55, comfortably above the neutral 50 level, suggesting a moderately bullish environment with room for growth before overbought conditions emerge.


