
A widening gap that often signals momentum building beneath the surface, and if the pattern repeats as it has in past cycles, this consolidation could soon give way to a sharp breakout.
In a recent X post, analysts highlighted the widening gap between global liquidity and current market prices. Liquidity has surged steadily to higher levels, while prices remain subdued around the $8.15 zone. This contrast signals that the market may be undervalued compared to the broader liquidity expansion taking shape.
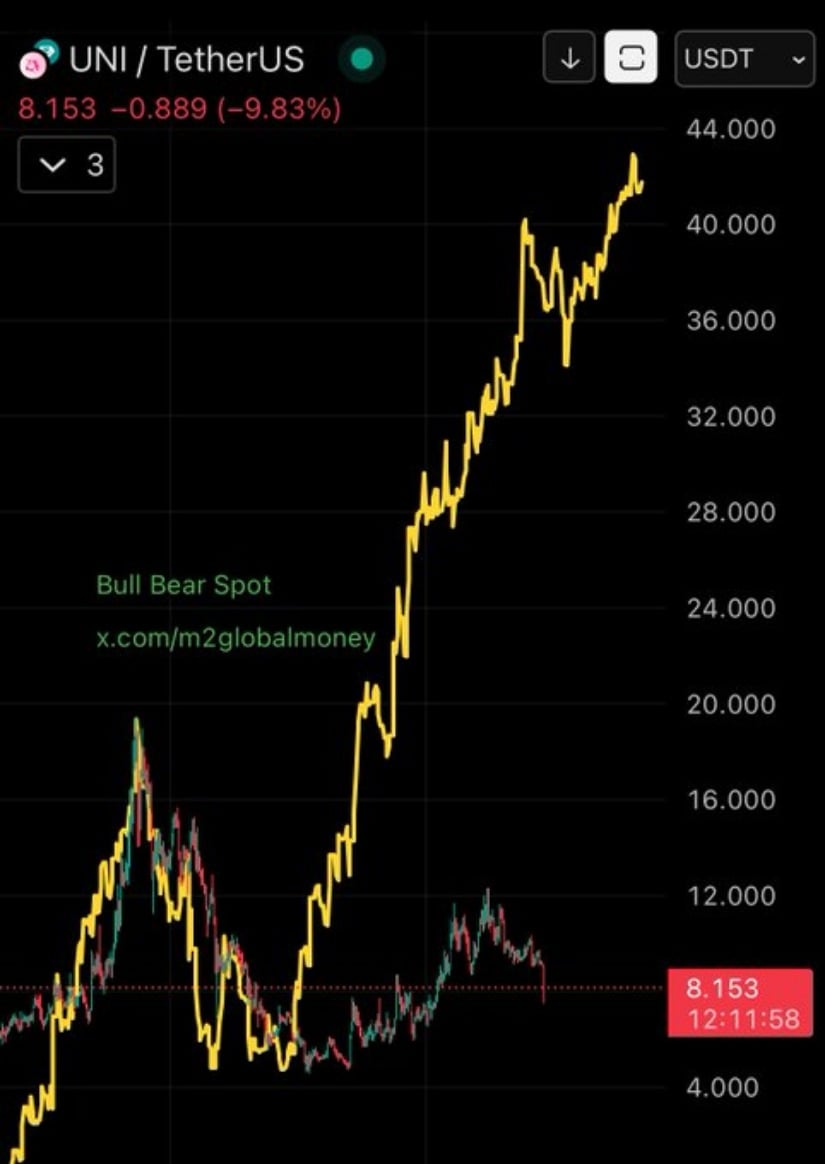
Source: X
Historical patterns suggest that such divergences rarely last. Previous cycles showed that when liquidity expands, prices tend to follow with delayed but sharp rallies. The chart’s sideways structure reflects accumulation, where traders quietly position themselves ahead of a stronger directional move. If history repeats, the current consolidation could be the calm before a significant breakout.
If upward liquidity momentum continues, breaking past the $10 resistance may act as the trigger for broader bullish momentum. Such a move could quickly open targets near $16 and potentially higher. With liquidity as the backdrop, conditions are aligning for a market catch-up rally that could unfold sooner than many anticipate.
Additionally, BraveNewCoin data shows Uniswap trading at $8.16 after a -7.26% drop in the past 24 hours, with market cap standing at $4.9 billion and trading volume spiking to $468 million.
The price has been moving within a tight band of $7.95 to $8.25, suggesting consolidation under pressure. The slip below $8.20 points to short-term weakness, while $8.00 now acts as the critical support level that must hold to avoid deeper losses toward $7.50.
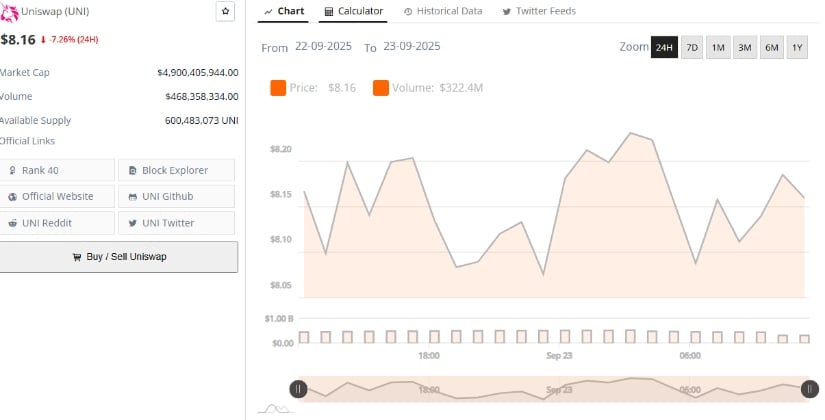
Source: Bravenewcoin
Despite the selloff, activity remains high, showing strong participation from both buyers and sellers. Volume has risen on each dip, hinting at possible distribution, yet liquidity trends may help provide a floor if momentum stabilizes.
If the asset can defend $8.00 and push back above $8.20, it could spark a recovery attempt, with $8.50 standing as the first resistance target in the near term.
At the time of writing, the coin was trading at $8.20 on the daily chart, marking a significant pullback from the $12.28 peak earlier this quarter.
The MACD remains in bearish territory, with the line positioned below the signal line and the histogram still negative, suggesting downward momentum is intact. Meanwhile, the Relative Vigor Index (RVI) sits at 34.34 against its moving average of 50.08, confirming weakening buyer strength and limited bullish conviction.
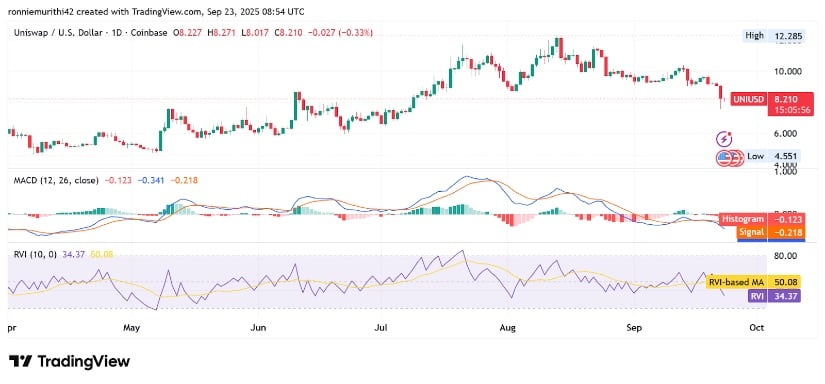
Source: TradingView
If the $8.00 support fails to hold, price action could slide further toward $7.50 in the short term. On the upside, reclaiming $8.50 would be the first sign of relief, with a potential retest of $9.20–$9.50 if momentum shifts back to the bulls. Until then, technical indicators continue to lean bearish, placing pressure on UNI to defend key support zones.


