
AAVE is exhibiting early signs of recovery owing to improved pricing dynamics. The market has started an ascent from the critical demand zone, although technical indications are just beginning to turn positive. Further confirmation of this trend remains necessary.
At the time of writing, AAVE is trading at $109.19 with a 24-hour volume of $487.65 million and a market capitalization of $1.64 billion. The token recorded a small gain of 1.24% over the last 24 hours, suggesting slow but steady price improvement overall.

Source: CoinMarketCap
Also Read | BlackRock Bitcoin Holdings Hit $59 Billion as ETF Inflows Rebound
On April 16, 2026, a crypto analyst, Crypto Patel, published a technical outlook observing that AAVE had established a bullish pattern post-Market Structure Shift (MSS). Based on the analysis, the price exhibited strong reactions from an order block on a higher time frame level, typically seen as the critical area for demand where buyers emerge.

Source: Crypto Patel’s X Post
Following this reaction, AAVE has entered the retracement stage, which is under close observation. This is indicative of liquidity being present above the current levels of prices, which can lead to an increase in the price, with the forecasted levels being at $108, $116.5, $125, and $132.
The technical analysis shows that the bullish pattern will become invalid if AAVE finishes its trade lower than $88.04 daily. As for the setup of an entrance, the area of $96 is watched as a likely place for a retracement.
Along with the structure, there are positive signals on the technical side as well. The RSI indicator has surged to 57.61 and crossed the signal line of 40.88, indicating rising momentum. The price of AAVE is currently trading at $109.19, just above its short-term moving averages of $105.73 and $96.41.
However, the MA Ribbon remains downward-sloping, with the levels of resistance placed at $122.71 and $162.80. Therefore, although a short-term reversal is developing, the overall trend remains unchanged for now.
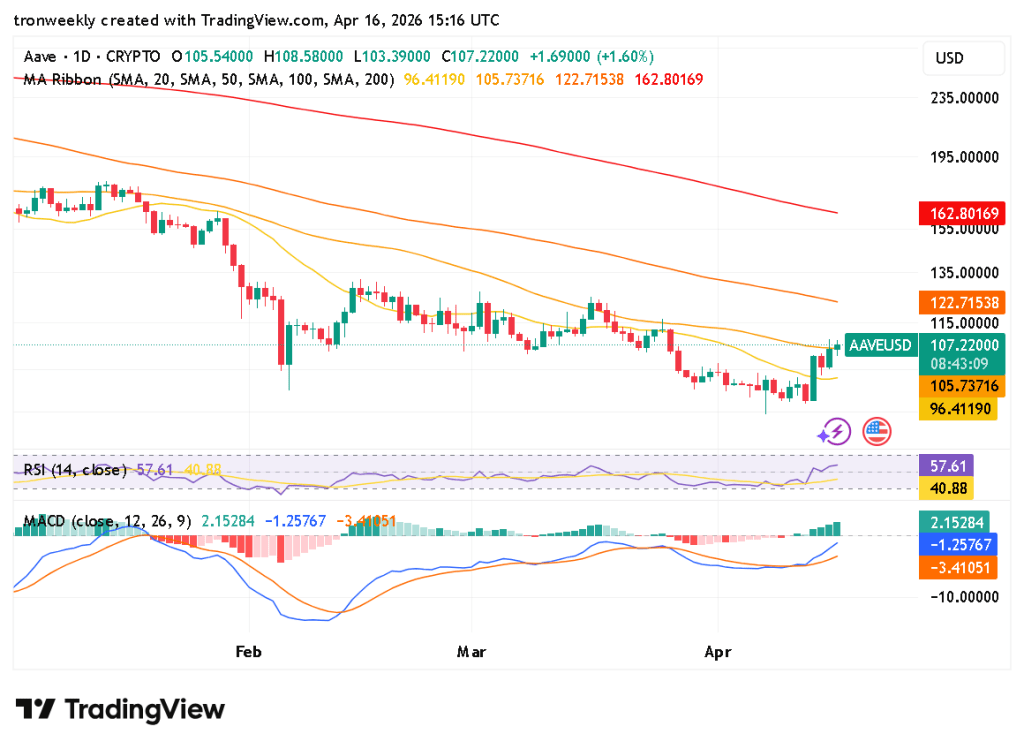
Source: TradingView
In addition, the MACD oscillator is moving into the positive side, where the MACD line value is currently 2.15 and is moving above the value of the signal line, which is -1.25, and the histogram has also turned positive. This shows that there is buying pressure building up, but at this stage, it’s still in its initial stages.
This article contains market analysis and price predictions. These are not guarantees. Crypto markets are volatile. Always DYOR. Not financial advice.
Also Read | South Korea Tests Tokenized Deposits in Government Payments

