
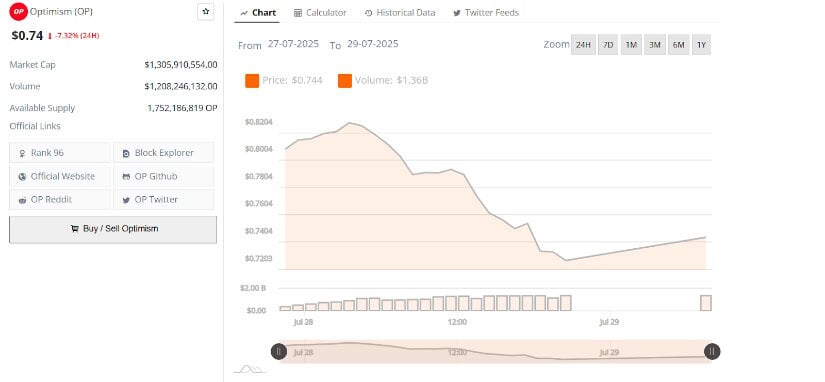
After briefly rallying to $0.82, OP fell 7.32% in the past 24 hours, now hovering near $0.74.
Despite the decline, analysts remain focused on structural developments signaling a possible trend reversal. The token’s recent movement below $0.76 has drawn attention to key support zones and the potential for a liquidity sweep before any bullish continuation.
According to analyst Liz, Optimism may retest the $0.745–$0.713 area before resuming its uptrend, while Alex Clay identifies a confirmed falling wedge breakout supported by RSI divergence. With projected targets at $1.975 and $2.775, Optimism recovery hinges on reclaiming short-term resistance levels.
Optimism (OP) Price declined by 7.32% in the last 24 hours, falling to $0.74 amid increased trading activity and broader market weakness. The asset, which had previously traded near $0.82 on July 28, faced renewed selling pressure that pushed it below the $0.76 support region. Volume surged past $1.2 billion during the session, reflecting heavy sell-side activity.
Source: BraveNewCoin
Although OP showed a minor recovery near the close of the daily candle, it remained below its short-term support range. The move left the price hovering at a level that could trigger further downside if no support is established. With momentum temporarily favoring the bears, traders are closely watching the $0.76 level to assess if it can be reclaimed in the near term.
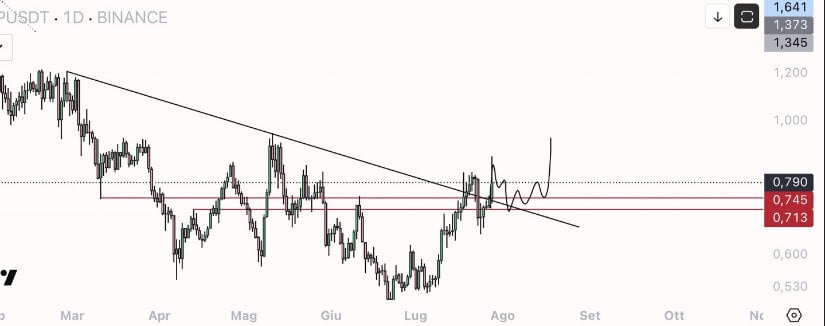
Analyst LiZ pointed out that OP had recently broken above a descending trendline that spanned multiple months. This breakout placed OP in a structural transition phase, positioning it above a resistance-turned-support zone near $0.79. According to LiZ’s projection, the price action suggests a potential sweep of liquidity in the $0.745–$0.713 region before a possible upward continuation.
Source: X
The analyst’s chart features a consolidation pattern that may form just above the descending trendline. Such a pattern typically indicates market indecision before a breakout. The move would be supported by price levels remaining above the reclaimed downtrend line. This technical formation, combined with the breakout, offers a framework for potential bullish continuation if broader sentiment stabilizes.
Crypto analyst Alex Clay identified a confirmed reversal pattern on the weekly chart of OP. The asset recently broke out of a long-standing falling wedge formation, a pattern historically associated with bullish trend shifts. Clay emphasized that the move is supported by a bullish divergence on the Relative Strength Index (RSI), which signals rising momentum even as prices formed lower lows.

Source: X
The analyst’s projection includes short-term and medium-term upside targets at $1.975 and $2.775, respectively. These levels correspond to prior structural resistance areas and Fibonacci retracement zones. With RSI trending upward, traders are watching if OP can stay above the wedge breakout to confirm a reversal.
The optimism structure suggests that the $0.74–$0.76 region could serve as a short-term base for price consolidation. Failure to hold above this area may expose the asset to lower support levels near $0.713, which also coincides with the bottom of liZ’s projected sweep zone. This level remains critical for maintaining a bullish structure.
If Optimism price begins to recover and pushes back above $0.76, traders may consider this a local reclaim that could lead toward testing $0.79 resistance once again. A successful consolidation followed by a clean breakout may act as a precursor to revisiting higher timeframe targets laid out in weekly projections. Until then, market participants continue monitoring trading volume and key support reactions closely.

