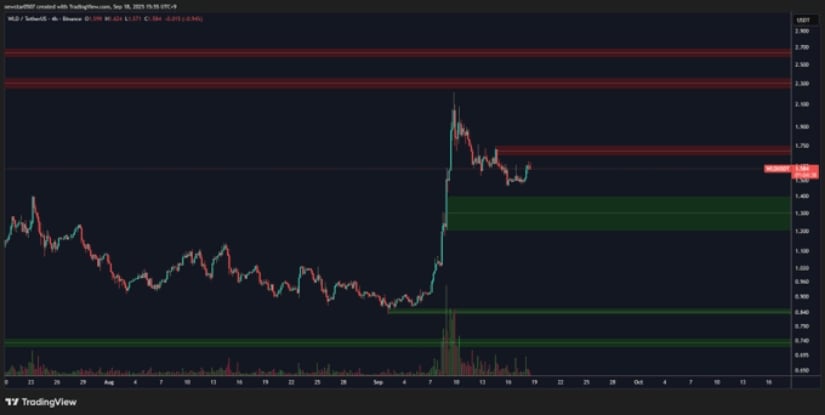
After reaching highs above $2 earlier this month, the token has entered a period of pullback but remains supported above critical zones. At the time of writing, the token trades near $1.58, with buyers closely monitoring whether momentum can build toward the $2.3 resistance level highlighted by analysts.
The 4-hour chart shows that WLD faces a major sell wall near $2.3, which has become the key resistance level to watch in the coming sessions. Price action has respected lower support zones, with strong accumulation observed around $1.40–$1.45.
The recent surge in volume that propelled the coin above $2 indicates that buyers remain active, but follow-through momentum has yet to confirm another leg higher.
Source: X
If the token breaks past the $2.3 ceiling, the symmetrical triangle suggests continuation toward $2.80 and beyond. However, failure to clear the overhead barrier could extend the current consolidation phase, forcing price action back into the $1.40 demand zone.
Market psychology at this stage reflects a cautious optimism, where buyers are positioning for an upside push but remain wary of rejection at higher levels. The tightening price range signals growing pressure, and any decisive breakout will likely trigger heightened volatility, amplifying both risk and reward for participants.
According to market data, the token is trading at $1.58 with a 3.50% increase in the past 24 hours, pushing its market capitalization to $3.22 billion. Daily trading volume remains robust at $494.5 million, underlining steady participation from both buyers and sellers. The available supply currently stands at 2.04 billion tokens, ranking WLD 53rd in the overall crypto market.
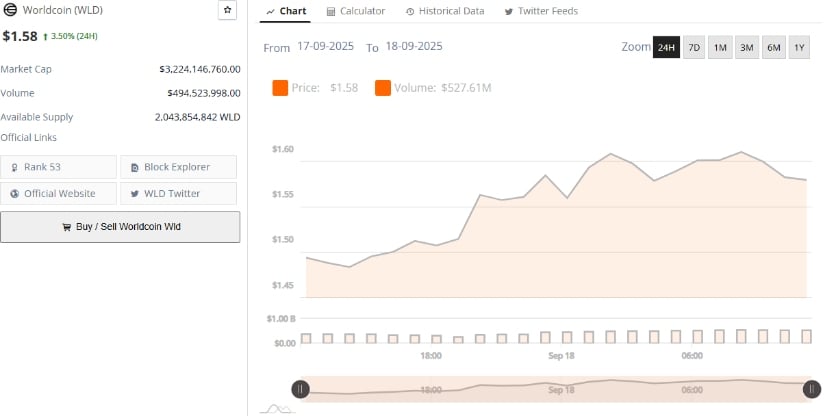
Source: BraveNewCoin
The steady rise in liquidity ensures that short-term volatility is absorbed efficiently, with inflows helping stabilize price action. Maintaining momentum above the $1.50–$1.55 range will be crucial to avoid deeper pullbacks, as this zone has repeatedly acted as a buffer against selling pressure.
On the daily chart, WLD trades near $1.57 after recent retracements from the $2.21 high. The MACD remains in a positive crossover, with the MACD line at 0.164 above the signal line at 0.152, suggesting bullish momentum is gradually building back. The histogram reading at 0.012 reinforces this view, showing that buyers are regaining control despite short-term weakness.
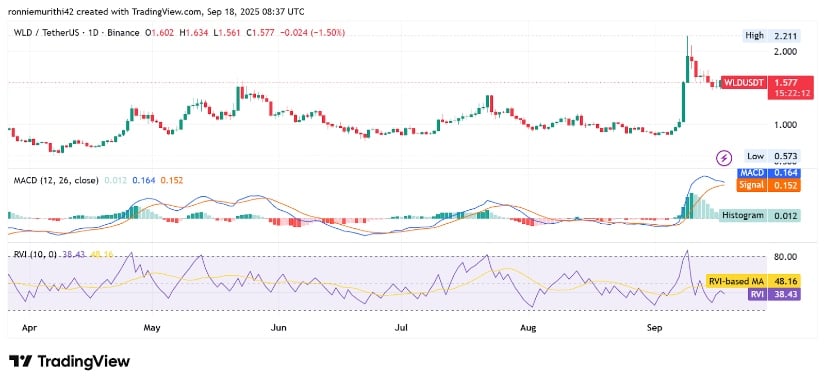
Source: TradingView
The Relative Volatility Index (RVI) is currently at 38.42, below its moving average of 48.16, indicating that market volatility has cooled but still leaves room for upward acceleration. Historically, such conditions have preceded renewed pushes toward resistance once volume returns.
If momentum persists and the triangle breakout confirms, the asset could revisit the $2.3 target zone quickly, with a broader technical roadmap pointing to $2.80 as the next milestone. Until then, consolidation between $1.45 and $1.60 continues to provide the base for potential upside.