
Algorand (ALGO) is sustaining its upward momentum as bullish sentiment strengthens across the market as of 3 April, 2026. The token has surged nearly 16.07% in the past 24 hours.
Over the weekly timeframe, ALGO has delivered an even stronger performance, gaining 45.56% as trader activity continues to rise and market confidence improves.
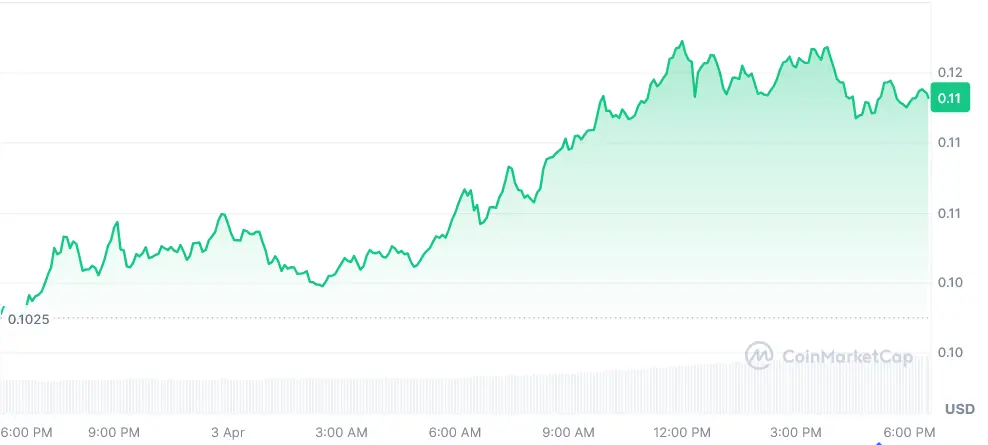
At press time, ALGO is trading around $0.1184, backed by increasing participation from market players. Its 24-hour trading volume has jumped to $200.08 million, reflecting a 59.29% daily rise.
Meanwhile, the market capitalization has climbed to $1.05 billion, marking a 64.99% increase and reinforcing the strength of the ongoing bullish trend, as per CoinMarketCap data.
Also Read: Algorand (ALGO) Price Compression Signals Imminent 20% Breakout Ahead
The weekly chart of Algorand (ALGO) shows a clear long-term downtrend, with price forming lower highs and lower lows. The chart highlights a strong support zone near $0.08, where a bounce has started, indicating a possible short-term recovery phase.
The chart clearly marks a projected upward move toward the $0.16 level, which is the primary target and represents nearly 45% upside.
Additional resistance levels shown on the chart include $0.28 as a mid target and $0.60 as a macro target if strong bullish momentum develops, as per the crypto analyst Crypto Feras.
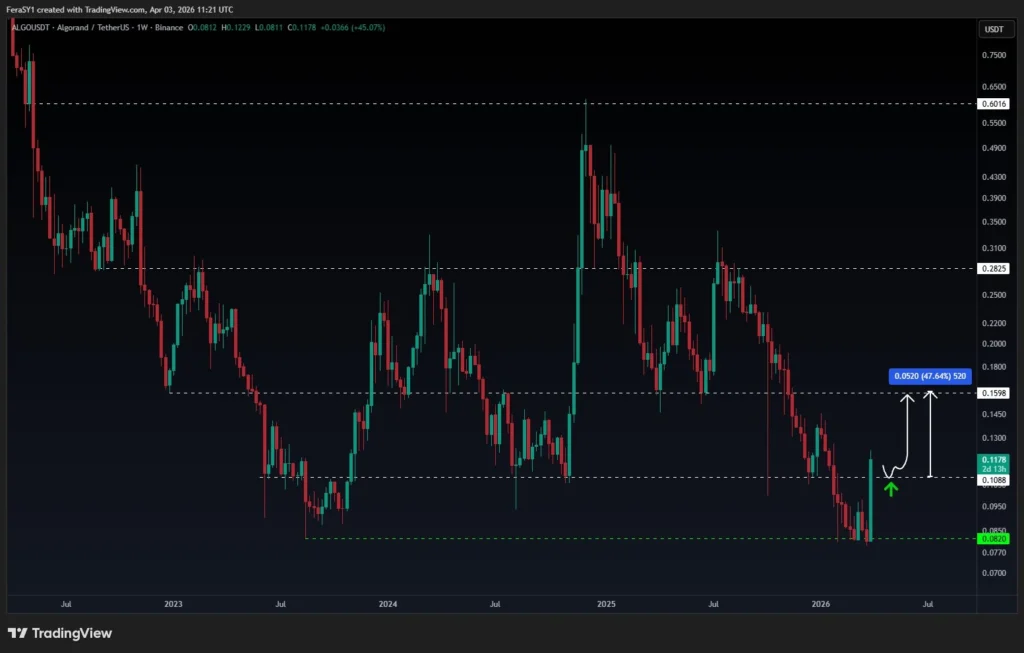
Despite the rally, the pattern shown in the chart will remain bearish as long as the price remains below the resistance level at $0.16.
This scenario will also suggest that a failure at this point might cause a rejection, leading to a decline towards the support level of $0.08.
Indicators related to momentum suggest a gradual change in sentiment. At the moment, the RSI level is 46.55, while its moving average is at 33.64. This means that the indicator is recovering from being oversold but has not yet reached positive momentum.
To summarize, bearish sentiments are fading, and a consolidation phase may be coming up. In general, momentum is neutral, which means that the market is neither overbought nor oversold.
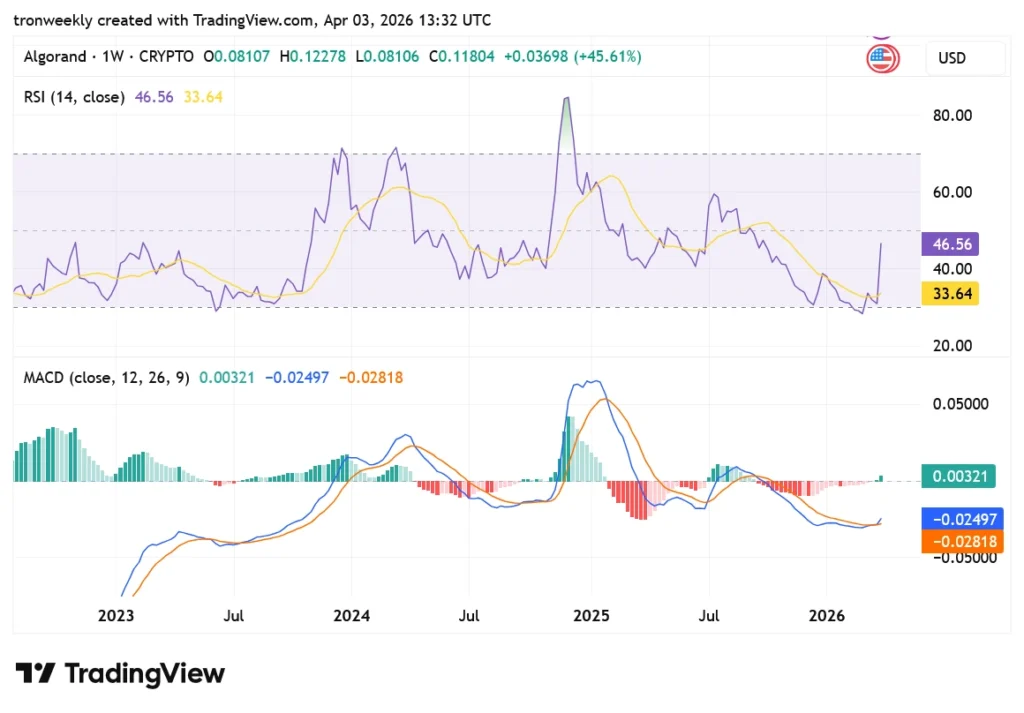
The MACD indicator is starting to show a soft bullish bias; MACD is at -0.02497, the signal is at -0.02818, and the histogram is at 0.00321.
The crossover is very small, but it seems like there is some bullishness developing. Strength is currently Frail, however, which means that more confirmation is needed.
In ALGO, there is an impressive short-term rally occurring, creating a lot of confidence in traders and possibly bringing in additional funds to continue with the bullish momentum.
The $0.16 level acts as a critical catalyst for the market; a breakout would be a clear indication that a reversal in trend has happened.
This article contains market analysis and price predictions. These are not guarantees. Crypto markets are volatile. Always DYOR. Not financial advice.
Also Read: Algorand (ALGO) Rally Continues with $0.2460 in Focus After 23% Surge

