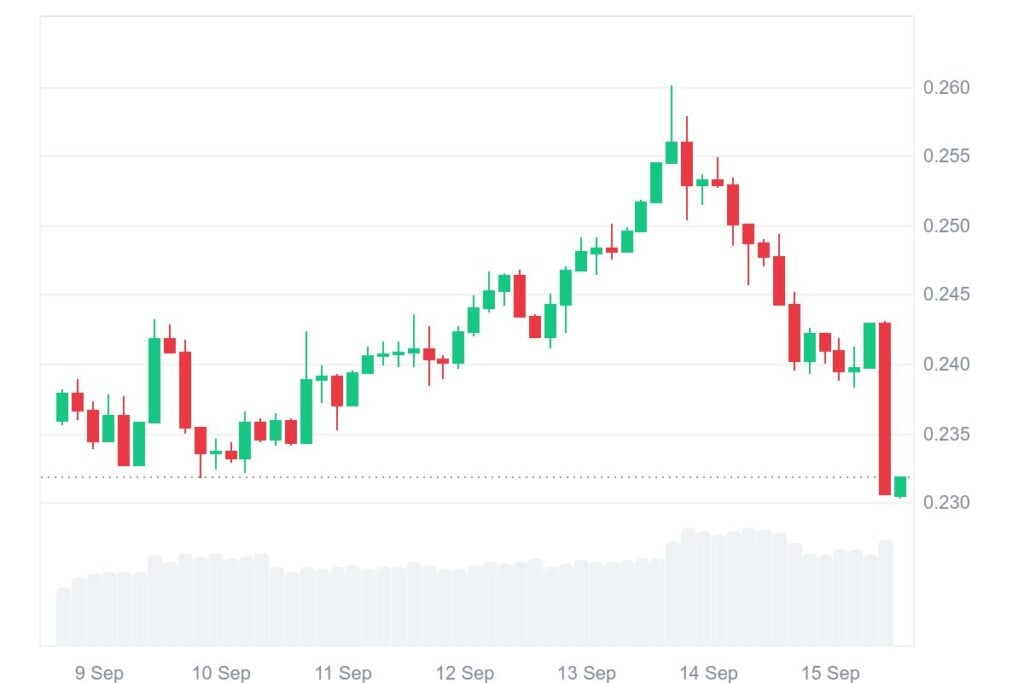
Algorand (ALGO) is experiencing sustained downward pressure as the broader crypto market weakens. Over the last 24 hours, ALGO has slipped by nearly 6.34%, reflecting the bearish sentiment. On a weekly chart, the decline is more modest at 1.31%, but sentiment remains negative.
At press time, the token is trading at $0.2318, supported by a trading volume of $104.5 million in the past day. This volume marks a 4.42% decrease compared to the previous session, signaling lower participation from traders. Meanwhile, the token market capitalization has fallen by 6.19%, settling at $2.03 billion.
The downward trajectory highlights investors’ caution, even as technical setups point to a possible recovery. Analysts argue that ALGO is approaching a critical inflection point.
Also Read: Algorand (ALGO) Bullish Reversal Strengthens, Price Targets $0.6 Breakout
According to crypto analyst Ali, Algorand is preparing to challenge a descending triangle formation. The price at $0.2323 sits just under the breakout zone, with $0.248–$0.250 highlighted as the main resistance range. A close above this level could confirm a reversal and pave the way for further gains.
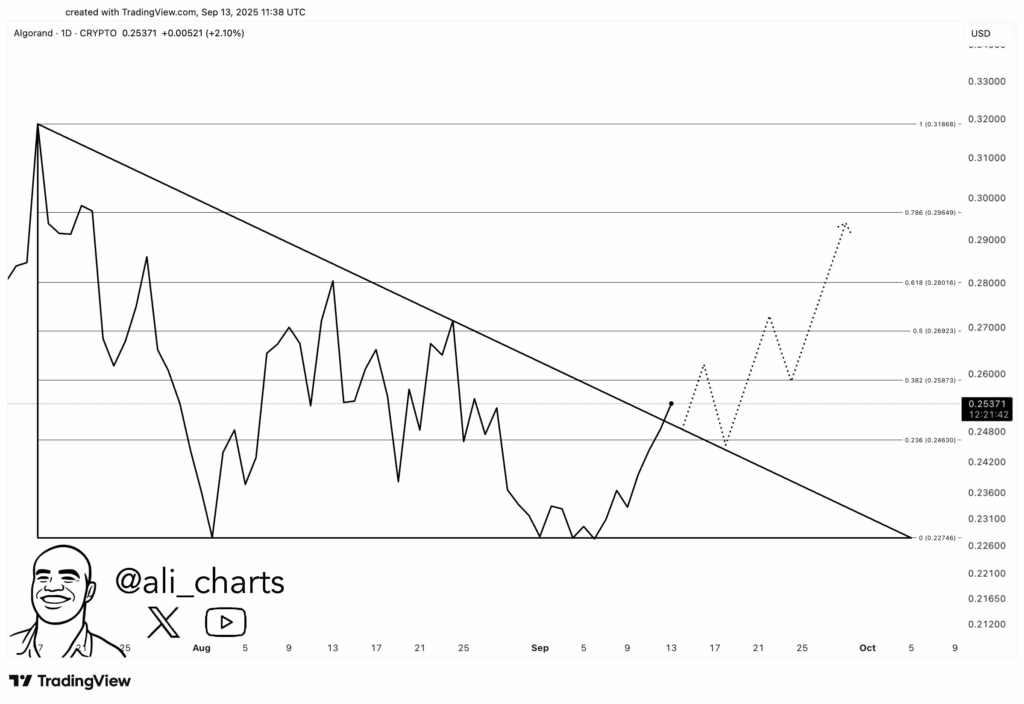
If the breakout holds, Fibonacci levels at $0.258, $0.269, and $0.280 serve as the next upside checkpoints. The key target remains at $0.29, a price backed by both the Fibonacci retracement line and psychological value. Reaching $0.29 will spark a reversal, potentially ending weeks of stagnant and subdued price action.
However, failure to overcome resistance might bring back downside potential. A breakdown at the resistance area might send prices back down to $0.236, and a further dip might test support at the $0.227 area. Loss of that support would keep consolidation going and further weaken the bull case.
Momentum indicators reveal a neutral picture of the token. The RSI in the weekly chart is at 49.34, which is marginally below its moving average of 51.42, showing confusion in the market. Trading around the neutral 50 line, the RSI suggests that the asset is in neither overbought nor oversold conditions. A breakout above 55 could increase bull confidence, while a break below 45 could arouse selling pressures.
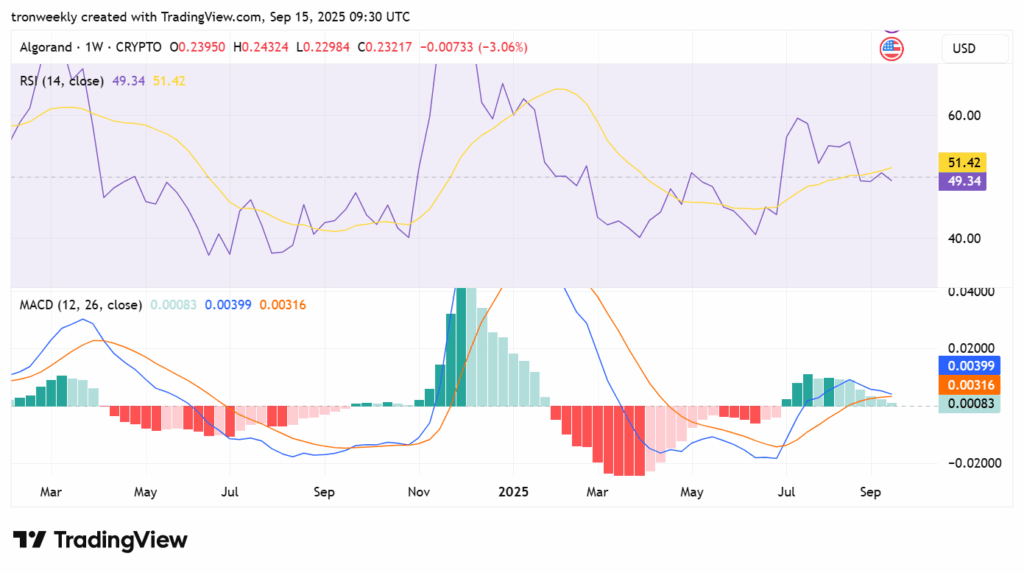
The MACD stays slightly positive, with its line at 0.00399 staying higher than that of the signal line at 0.00316. A positive histogram of 0.00083 provides support, though declining bars are forecasting dwindling buyer enthusiasm.
Without more significant inflows, current dynamics face the possibility of swinging back into consolidation. Meanwhile, traders are trying to establish if Algorand will break out of that resistance towards $0.29 or pessimistic sentiments will prevail.
Also Read: Algorand Foundation Proposes it’s Blockchain To Musk’s Government


