
Amazon (AMZN) shares were among the top gainers in the equity markets yesterday, rising more than 4% and closing above $235 for the first time since February 2025.
The rally was fuelled by reports that Kuiper – Amazon’s project aimed at providing internet access via a network of low-Earth orbit satellites – has signed a partnership agreement with JetBlue. From 2027, this will allow free Wi-Fi to be offered on board selected aircraft. As a result, Amazon’s project is emerging as a new competitor to Elon Musk’s Starlink.
Technical Analysis of Amazon (AMZN) Chart
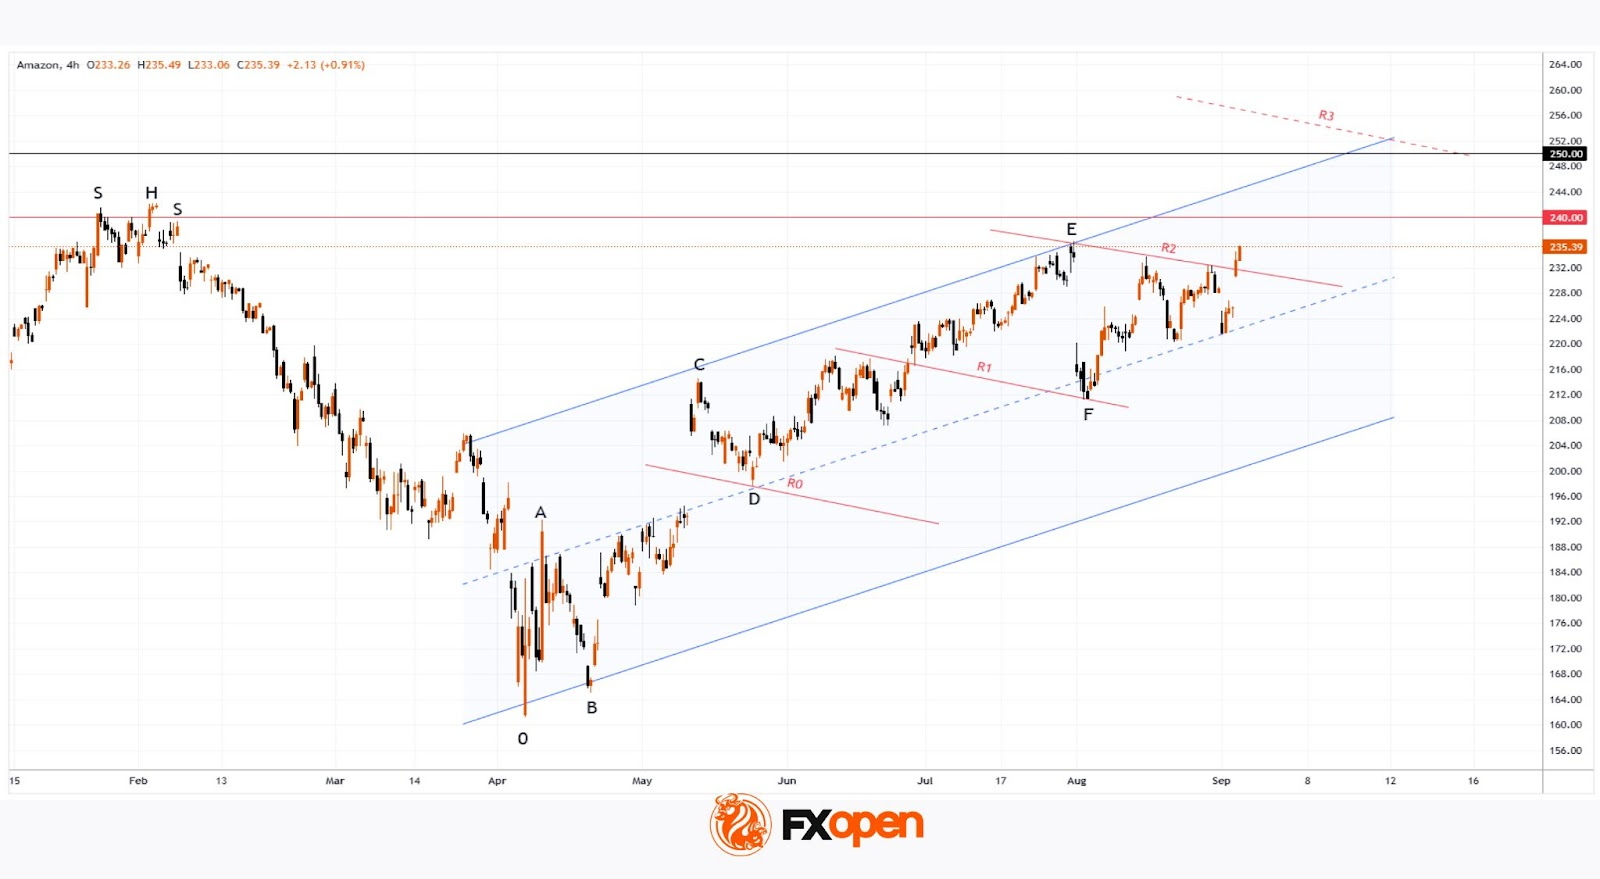
Since August, AMZN’s price fluctuations have been forming a bullish structure of higher highs and higher lows (0-A-B-C-D-E-F).
These and other key turning points provide the basis for constructing an upward channel (shown in blue), with the following implications:
→ in the near term, the price could surpass the previous high at point E, extending the bullish structure;
→ the channel median has proved to be an important support level – it held the price during the early August decline and continued to play this role throughout the month.
It is worth noting that AMZN’s upward momentum within the channel is unfolding step by step, making it possible to draw intermediate resistance lines R0, R1, and R2. In this context:
→ they can be viewed as examples of a bullish flag chart pattern;
→ yesterday’s rally with a bullish gap may signal the start of a new growth phase towards the next resistance at R3.
However, on this path, hurdles could come from:
→ the upper boundary of the blue channel;
→ the $230 level, around which a bearish head and shoulders pattern formed in February, marking this year’s high;
→ the psychological level of $250.

