
Analysis of recent price charts and market data illustrates a market balancing between demand and supply, with clear technical markers indicating bullish intent, albeit amid some caution around key resistance areas.
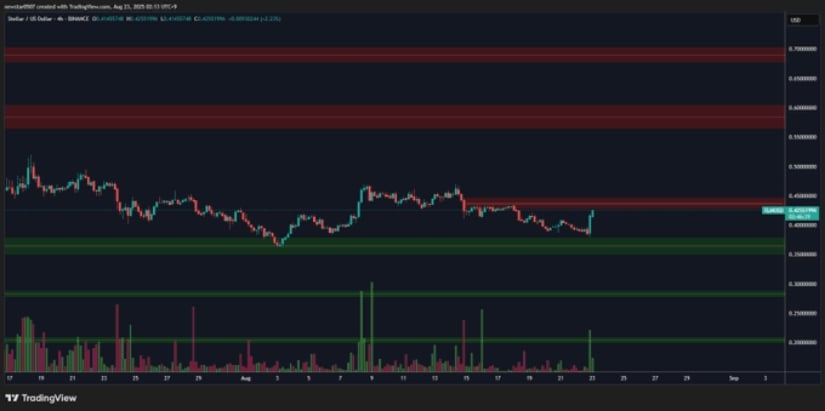
In a recent X post from an analyst, CW(@CW8900 on X) emphasizes XLM’s horizontal trading zones where the price fluctuates between $0.41 and $0.42, recovering from recent declines. Robust green demand zones exist between $0.30 and $0.35, where prior buying absorbed significant selling pressure.
This range serves as a vital support base for the mid-term outlook, potentially acting as a springboard for further gains if retested.
Source: X
Resistance clusters around $0.50 to $0.60 form significant supply zones, with the $0.60 level standing out as a major barrier, as noted by CW. Successfully breaking above $0.60 would signal a bullish shift, potentially unlocking a move toward $0.70 to $0.75.
Volume surges near support suggest active accumulation, reinforcing upward momentum as long as the $0.35 support holds. A break below this base could expose the token to deeper declines near $0.28.
Additionally, BraveNewCoin’s 24-hour data shows the asset gaining 5.27%, lifting its market capitalization to $12.9 billion and trading volume approaching $500 million. Intraday price action peaked around $0.42 to $0.43 before a slight pullback, reflecting profit-taking but also a strong rebound off the $0.38 support level.
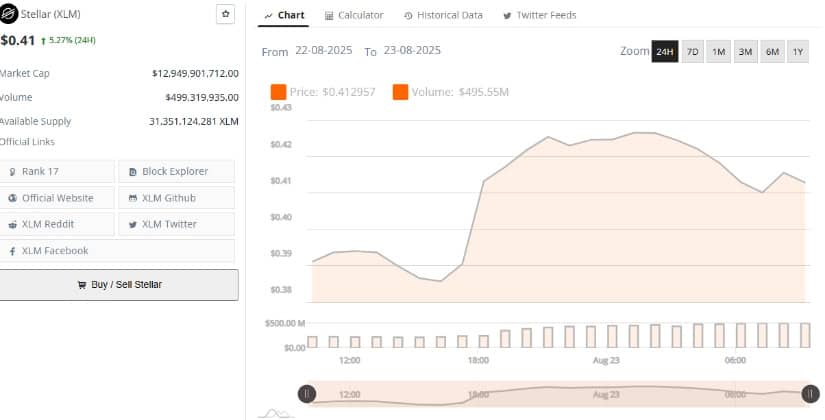
Source: BraveNewCoin
Volumes remain high near local tops, indicating sustained buyer interest even amid retracements, which lessens the risk of sharp corrections. However, the price curve flattening above $0.42 points to resistance.
Holding above $0.40 is critical for maintaining bullish momentum and preventing a fallback to the $0.38 demand zone. The memecoin near-term trajectory remains tied to broader altcoin market trends and Bitcoin’s performance, where weakness in BTC could pressure XLM toward $0.37 support.
On the other hand, TradingView’s daily chart shows XLM price consolidating within Bollinger Bands ranging from $0.385 to $0.462, currently sitting just below the middle band at $0.4237. This reflects a neutral to cautious market stance. A decisive breakout above the upper band could confirm renewed buying strength, whereas a breakdown below the lower band might open routes toward $0.35.
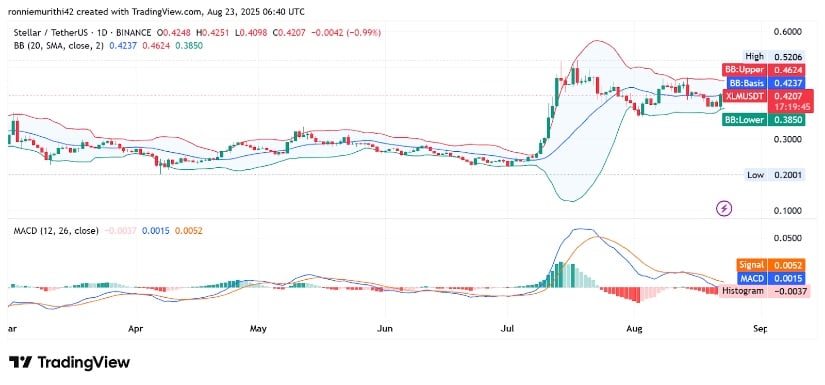
Source: TradingView
The MACD indicator is signaling weak but improving momentum. The MACD line at 0.0014 remains below the signal line at 0.0052, and the histogram is slightly negative but contracting.
This points to diminishing bearish momentum and raises the prospect of a bullish crossover if buying interest intensifies. Market participants might interpret this setup as a potential springboard for an upward move, although momentum remains fragile and could lead to sideways trading if resistance levels hold.


