
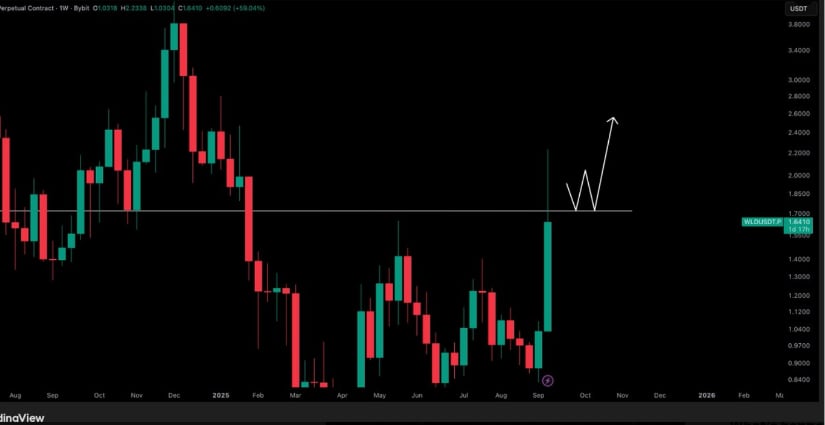
Analysts, including Crypto Tony, view a decisive close above $1.70 as critical for confirming a breakout and starting a sustained upward trend. A successful reclaim could flip this level into support, opening the path toward $2.20 and higher targets.
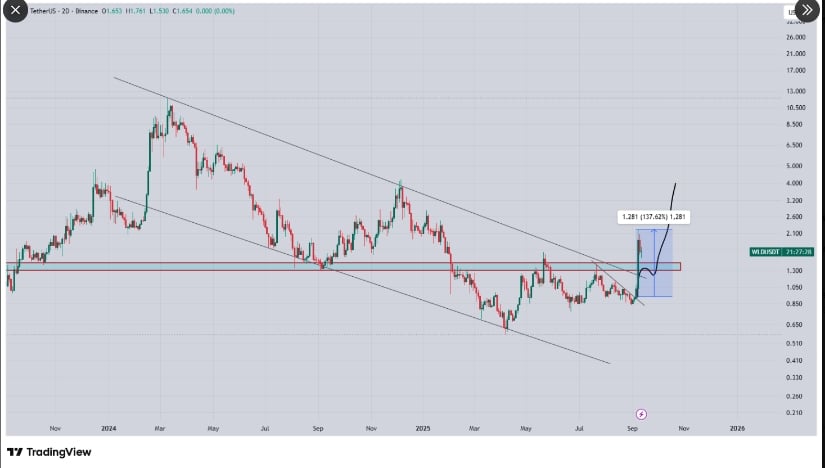
Supporting the bullish case, World Of Charts highlights a 130% intraday jump that broke a long-term descending channel and the crucial $1.30–$1.35 resistance. With trading volume near $879 million and a market cap of $3.32 billion, the altcoin shows strong demand around $1.60–$1.65. Holding this zone would validate the breakout and keep the rally toward $3.00–$3.20 in focus.
Worldcoin posted a powerful weekly rally, gaining nearly 59% to trade near $1.64. The token is approaching a horizontal resistance level at $1.70 that has limited upside moves in recent months. Technical analyst Crypto Tony noted that a decisive weekly close above $1.70 could confirm a new upward trend, setting the stage for further gains.
WLDUSDT 1-WK Chart | Source:x
The weekly chart indicates a potential breakout-and-retest formation. A move above $1.70 would likely flip this level into fresh support. If buyers maintain momentum, subsequent targets on the chart point toward $2.20 and higher. Until the $1.70 level is reclaimed, analysts advise caution, as failure to close above this area may lead to renewed consolidation.
Another key technical view from World Of Charts, which observed that the asset surged more than 130% within hours during the current move. The token broke out of a long-term descending channel that had capped price gains since early 2024. This breakout also lifted it above a crucial horizontal resistance between $1.30 and $1.35 that had repeatedly halted prior advances.
WLDUSDT Chart | Source:x
According to the analysis, this structure sets the stage for a potential continuation toward the $3.00 to $3.20 zone. The projected range is based on a measured move from the breakout pattern. Traders will be monitoring a likely retest of the $1.30 support area to confirm the strength of this upward reversal and to see whether buyers can maintain control at that level.
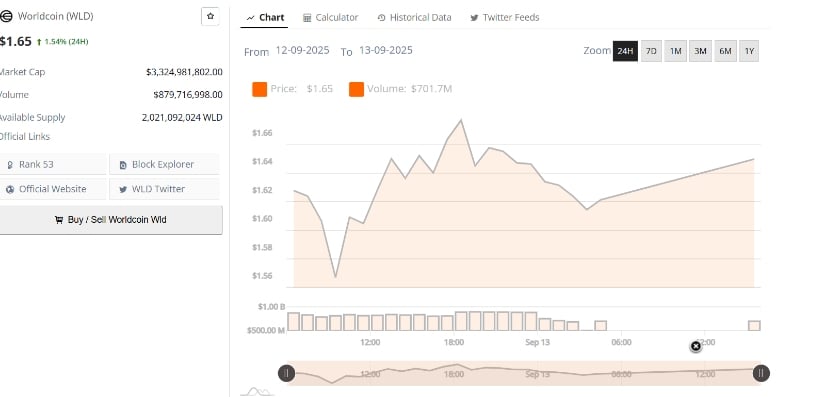
On the intraday chart, WLD traded at about $1.65 after a 1.54% daily gain. Market data showed a brief early-session dip to $1.56, followed by steady buying interest. Price action formed successive higher lows and pushed toward $1.65 as trading volume increased to roughly $879 million, with market capitalization standing at $3.32 billion.
WLDUSD 24-Hr Chart | Source: BraveNewCoin
The 24-hour data also indicated concentrated buying pressure around the $1.62 to $1.65 range. This accumulation phase suggests that traders are defending the immediate support zone near $1.60. A close above $1.65 could strengthen short-term bullish momentum and open a path for another attempt to clear the $1.70 barrier if the current pattern persists.
Technical projections show that if Worldcoin reclaims and sustains above $1.70 weekly, the next notable resistance could emerge near $2.20. Beyond this point, the long-term breakout measured target points toward the $3.00 to $3.20 region identified by World Of Charts. This projection remains conditional on buyers successfully defending the $1.30–$1.35 support zone on any pullbacks.
For now, the market is watching whether Worldcoin can maintain the higher lows and robust trading volumes established in recent sessions. Traders see these factors as essential to preserving the bullish structure and enabling a continuation of the upward trend. The combined technical signals from multiple timeframes keep focus on the $1.70 level as the gateway to a broader advance toward the $3.20 target zone.


