
Analysts note that this type of sideways action often sets the stage for bigger moves once momentum builds.
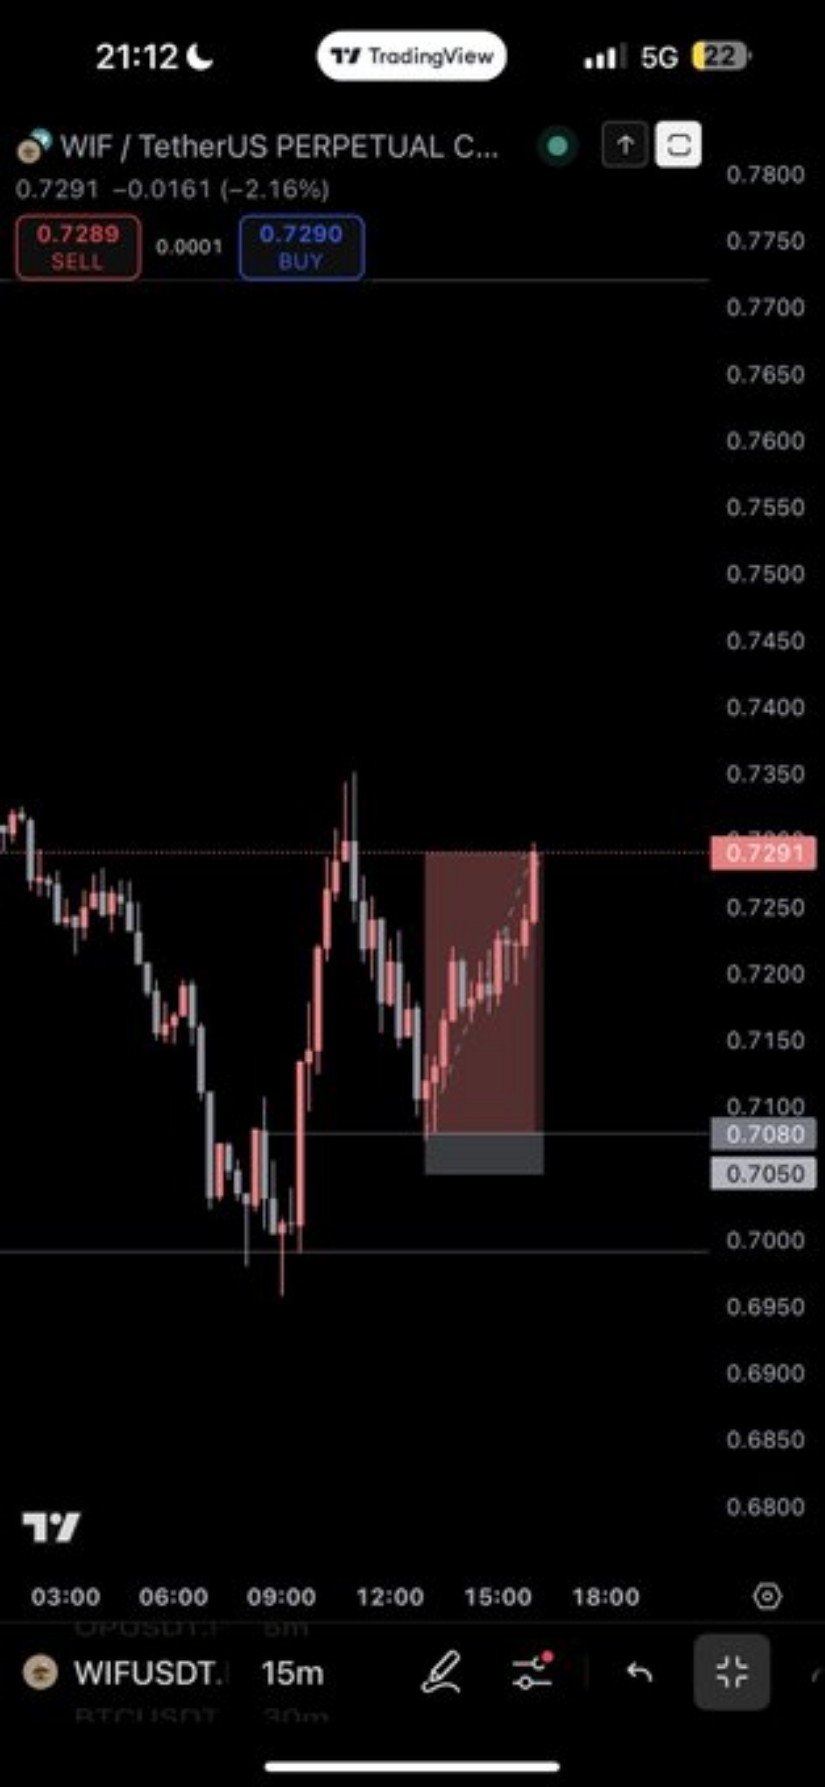
On the lower timeframes, particularly the 15-minute chart, WIF price action has been marked by sharp swings. The token dropped toward the $0.705–$0.710 support zone before staging a quick recovery back toward $0.729. This intraday rebound suggests that buyers are stepping in aggressively near local lows, preventing deeper declines.
Source: X
However, the repeated rejections near the $0.73–$0.74 range highlight a lack of momentum to push higher. Short-term traders, such as analyst Freda, pointed out the day’s choppy moves before noting they were “done for the day,” signaling that the token remains a high-volatility play dominated by quick rotations in liquidity.
This pattern of selling into rallies and buying dips indicates that the asset is currently range-bound, with market participants unwilling to commit to a clear breakout.
According to BraveNewCoin data, Dogwifhat is currently priced at $0.73, down 1.91% in the last 24 hours. Its market capitalization sits at $727 million, with daily trading volume of $159 million, underscoring strong liquidity despite the lack of a decisive trend.
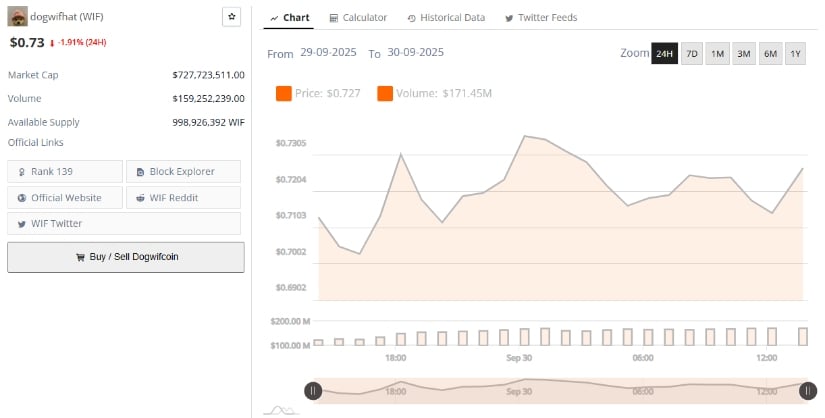
Source: BraveNewCoin
Nearly 999 million tokens are in circulation, placing the project at rank 139 among cryptocurrencies by market cap. This steady presence in the mid-cap range reflects the balance between sustained community enthusiasm and the natural volatility that comes with meme-inspired digital assets.
While the modest decline in the last day signals caution, the broader snapshot shows the crypto holding its ground above $0.70 — a key psychological level that traders will be watching closely in the near term.
On the daily timeframe, WIF is trading at $0.709, slipping below the 20-day moving average, which often serves as a trend guide. The chart shows a series of lower highs since peaking near $1.39, pointing to persistent bearish pressure.
That said, indicators suggest that selling momentum may be cooling. The Chaikin Money Flow (CMF) stands slightly positive at +0.04, hinting at modest capital inflows despite price weakness. This could mean that accumulation is quietly taking place, even as the coin consolidates near local lows.
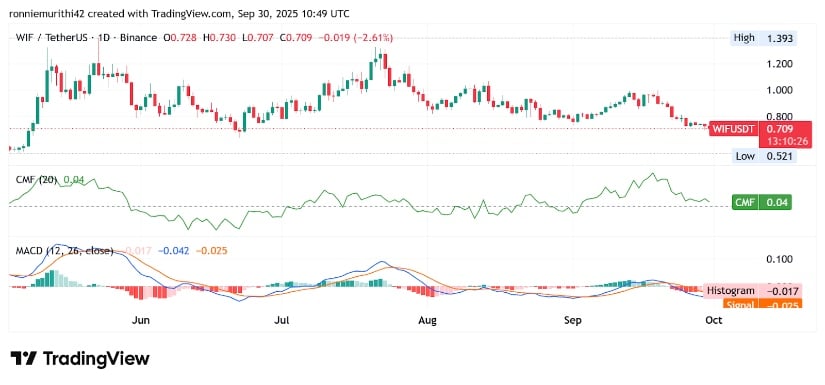
Source: TradingView
The MACD indicator tells a more cautious story. The MACD line is at -0.042 against the signal line at -0.025, with a histogram reading of -0.017. These values reflect lingering bearish momentum, though the narrowing histogram bars suggest downside strength is weakening. A bullish crossover on MACD would be needed to confirm a potential reversal.
Key technical levels to watch include immediate support around $0.70 and stronger demand at $0.68. On the upside, resistance lies near $0.75, with a decisive break above this level required to signal that bulls are regaining control.

