
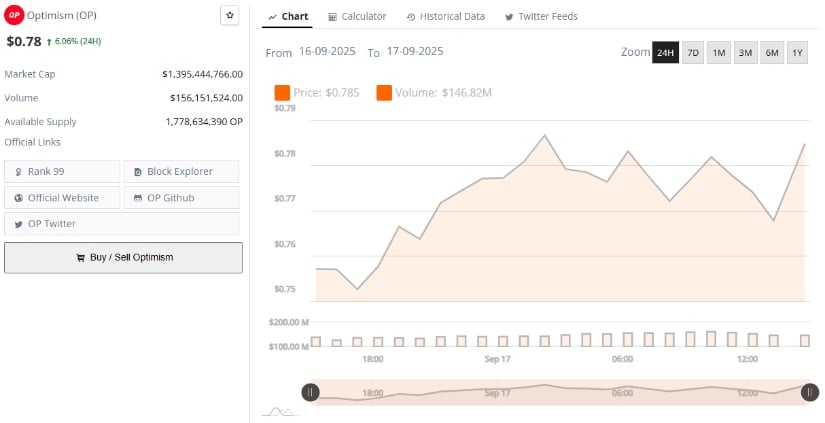
Analysts point out that the recent resilience above demand zones could pave the way for a recovery move if momentum holds. At the time of writing, the asset trades near $0.78 after gaining 6.06% in the last 24 hours.
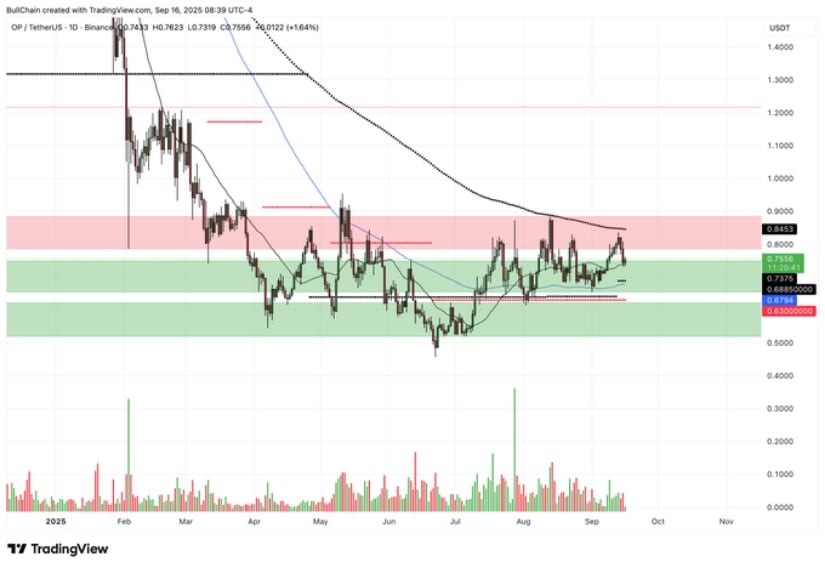
Technical analysis shared on X by BullChain (@BullChain) highlights OP as an example of a bottom structure in development. The daily chart shows the token holding steady above support levels around $0.68–$0.75, with overhead resistance marked between $0.85 and $0.90.
Source: X
This accumulation phase reflects a market in balance, with buyers gradually absorbing supply as sellers lose strength. A decisive break above resistance would validate the bottoming thesis and open the door for a stronger upward move. Analysts suggest that a successful retest and breakout could lead to a sustained recovery phase, provided that trading volumes increase to confirm bullish conviction.
Until then, the asset continues to trade within its consolidation zone, with price structure showing the characteristics of a base-building stage, often a precursor to extended rallies.
According to BraveNewCoin, Optimism currently holds a market capitalization of $1.39 billion, ranking it 99th among all cryptocurrencies. Daily trading volume stands at $156.1 million, underlining steady liquidity for market participants. The token’s circulating supply is recorded at 1.77 billion tokens.
Source: BraveNewCoin
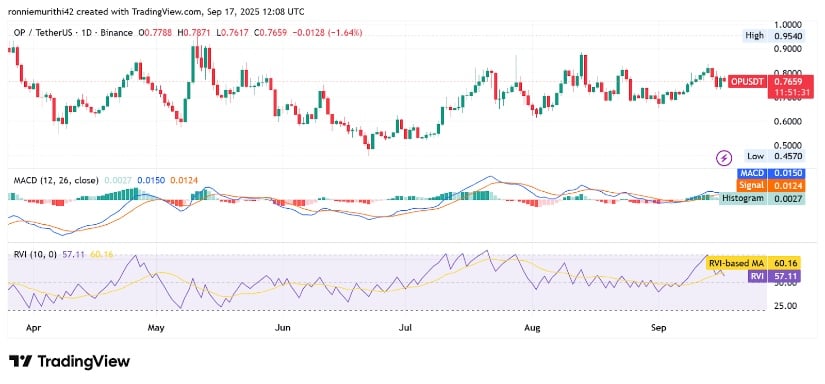
Market sentiment has stabilized following recent volatility, with the asset recovering from lows of $0.4570 to recent highs near $0.95. The current consolidation range is drawing attention as a battleground between buyers and sellers.
Holding above support levels strengthens the case for a bullish reversal, while failure to defend the zone around $0.68 could invite further downside pressure.
On the TradingView daily chart, OP trades at $0.7677, with momentum signals leaning cautiously bullish. The MACD line (0.0152) remains above the signal line (0.0124), supported by a positive histogram reading of 0.0028, suggesting buying pressure is gradually building.
Source: TradingView
The Relative Vigor Index (RVI) prints 57.13, slightly below its moving average of 60.16. This reading indicates balanced market sentiment, with buyers holding a modest advantage but not yet commanding full control.
Together, these technical signals suggest that the asset may be in the early stages of recovery. A confirmed breakout above the $0.85–$0.90 resistance range would provide stronger evidence for a trend reversal, potentially positioning the token for a broader move higher. Until then, consolidation within current ranges continues to form the foundation for what could evolve into a longer-term bullish structure.


