
Analysts suggest that overcoming the 21-week EMA may align the token with the broader recovery trend visible across altcoins. Trading data and technical indicators provide additional context on where the market currently stands.
In a recent X post, analyst Michaël van de Poppe highlighted that Optimism price is nearing the 21-week EMA, a point often seen as a trigger for larger market moves. He noted that several altcoins have already crossed this line, sparking renewed he token for stronger performance across the sector.
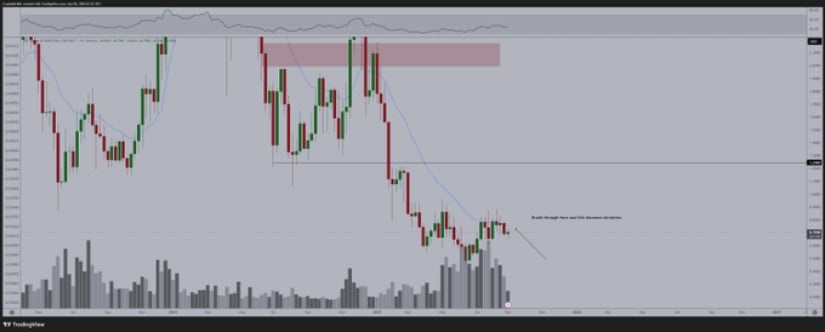
Source: X
Charts reveal that this crypto asset has consistently built support during pullbacks, with volumes indicating buyer interest at lower price ranges. This steady activity reduces downside risk while suggesting that traders are waiting for a breakout to commit further.
Market structure also shows a narrowing price range, signaling that volatility is being compressed. Once momentum breaks in either direction, the coin could experience a sharp adjustment, with resistance above the EMA serving as the immediate hurdle.
Additionally, BraveNewCoin data shows Optimism price trading near $0.72, supported by a market capitalization above $1.28 billion and daily volumes of around $139 million. This liquidity level indicates active participation, even as the token trades within a relatively tight range.
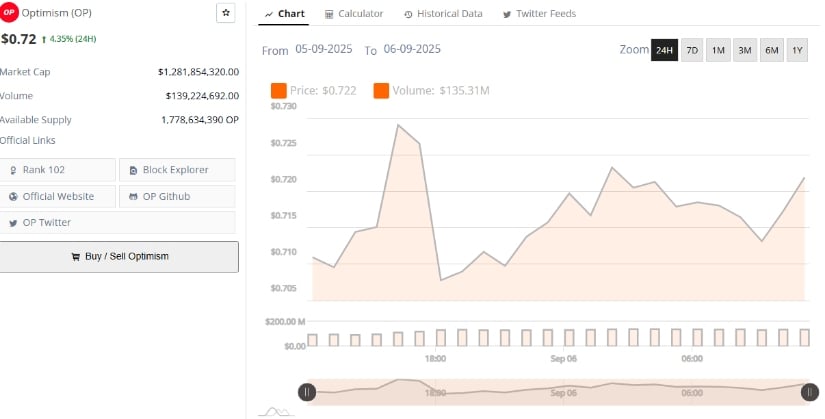
Source: BraveNewCoin
Over the last 24 hours, price movements have remained between $0.71 and $0.73, reflecting stability despite broader fluctuations in the crypto market. This pattern highlights consistent market engagement without significant volatility spikes.
With a circulating supply of 1.77 billion tokens, supply-side factors remain important to track. Still, the stable volume profile indicates that interest in the coin has not diminished, reinforcing a balanced outlook in the near term.
At the time of writing, according to TradingView, OP was trading at $0.7121. The daily chart shows the token fluctuating within Bollinger Bands, with the baseline at $0.7184 serving as a pivot. The upper band is placed near $0.7880, while the lower boundary sits around $0.6488, giving the asset a defined trading corridor in the short term.
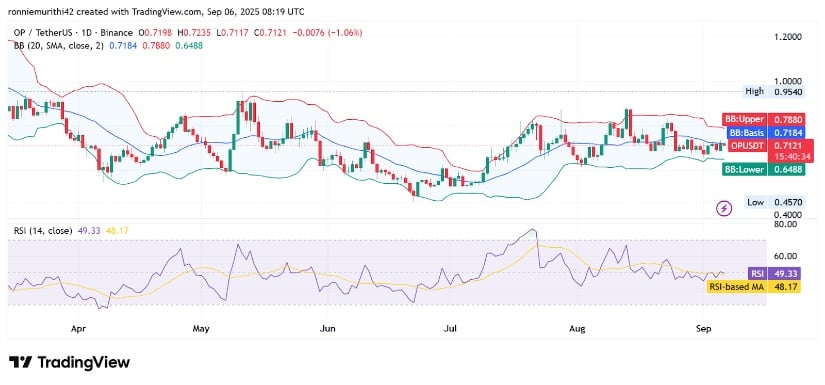
Source: TradingView
The Relative Strength Index (RSI) currently holds at 49.33, indicating neutral momentum. This positioning suggests that the coin is neither overbought nor oversold, leaving room for directional movement depending on external catalysts or shifts in market sentiment. The RSI’s proximity to the midline underscores a period of consolidation.
Candlestick movements from the past weeks reveal a narrowing range, which often precedes volatility. If the asset maintains its foothold above $0.70 and tests the mid-band levels successfully, traders may anticipate a move toward the upper Bollinger Band. Conversely, a failure to sustain current levels could push the token back toward the lower range, though steady support remains visible.


