
Analysts suggest this area could act as a springboard for a bullish reversal, and with fresh ETF headlines adding excitement to the mix, momentum is building. Together, these signals frame a pivotal week for the asset, where both technicals and fundamentals align.
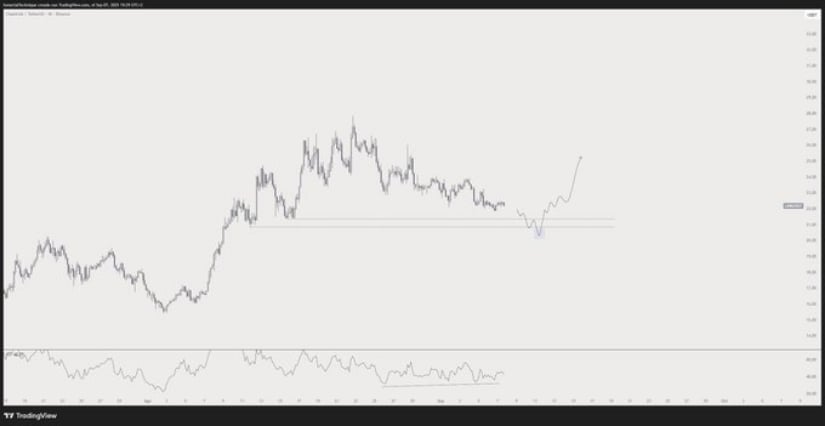
Inmortal’s analysis highlights Chainlink approaching a pivotal support range. The chart maps a scenario where the price dips into this zone before rebounding sharply. This move would mark the end of the pullback phase and the start of a new upswing.
The outlined trajectory projects the token could climb into the $30–$35 range once buyers step in. These targets align with prior resistance zones where the coin struggled to hold gains. Traders now view this support level as a make-or-break area for the next leg up.
Source: X
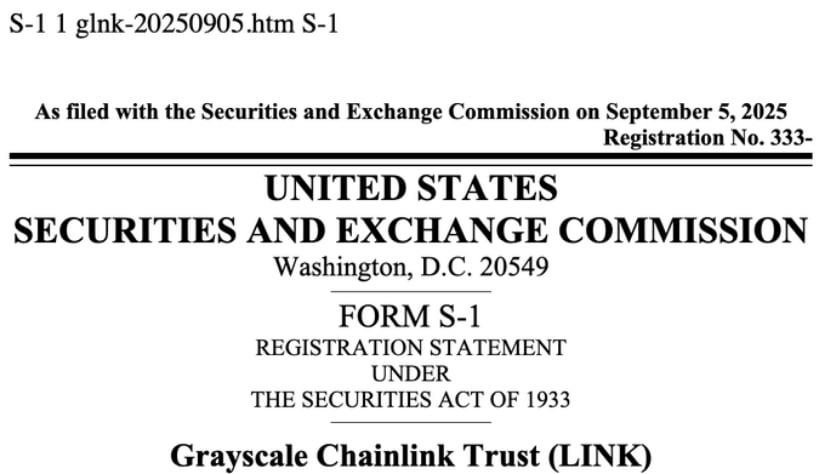
Adding fuel to this outlook, Lark Davis noted Grayscale’s filing for a Chainlink ETF. Such a move could bring institutional flows into the market and boost mainstream accessibility. For traders, the ETF story strengthens confidence that the coin could attract more sustained demand.
Source: X
Together, the technical support base and fundamental ETF momentum give the asset a unique dual narrative. Analysts are aligning around the view that the coming bounce could be powerful if buyers step in at current levels.
On one hand, BraveNewCoin data shows the coin trading around $22.44, up 0.81% in the past 24 hours. Its market cap sits near $15.23 billion, supported by $455.6 million in daily turnover. This liquidity keeps the asset among the most actively traded cryptocurrencies.
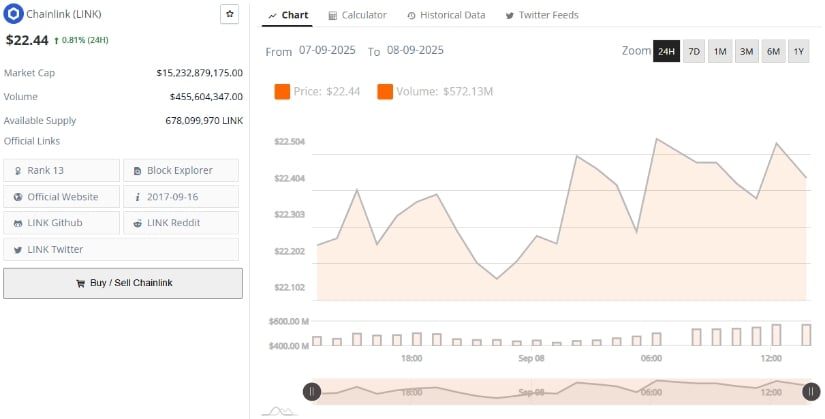
Source: BraveNewCoin
The price has hovered above $20 for weeks, reflecting resilience despite market-wide volatility. Analysts view this as an encouraging sign that selling pressure is being absorbed. With steady volume and strong rank, LINK continues to attract both traders and long-term holders.
These fundamentals reinforce the idea that the token is consolidating before its next big move. If the support zone holds, the groundwork for a rally toward higher ranges remains in place.
On the other hand, at the time of writing, TradingView showed the coin trading at $23.12, with a daily high of $23.20 and a low of $22.23. The Bollinger Bands set $23.95 as immediate resistance and $21.10 as critical support. A close above the middle band could unlock momentum toward higher targets.
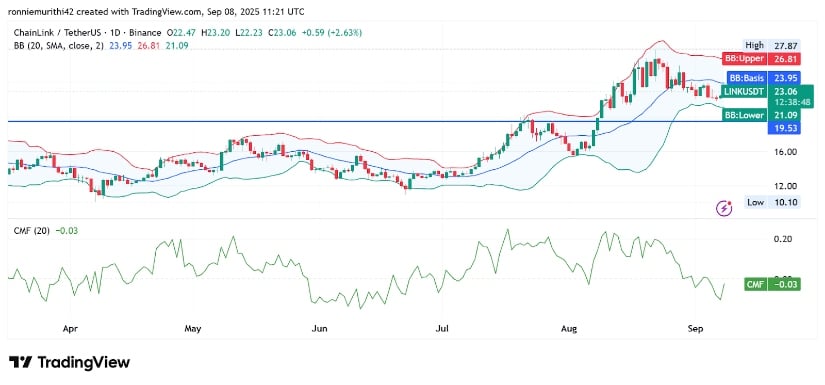
Source: TradingView
The Chaikin Money Flow (CMF) sits at -0.02, showing mild outflows but close to neutral territory. This signals a market waiting for stronger conviction from buyers or sellers.
If support holds near $21 and momentum turns positive, traders may eye $26.81, $27.87, and eventually the $30–$35 range. Failure to defend support, however, could mean extended consolidation before another attempt higher.


