
Artificial Superintelligence Alliance (FET) has declined 4.03% over the past 24 hours, reflecting short-term selling pressure.
As of March 21, 2026, the broader trend remains bullish, with FET maintaining strong momentum and recording an impressive 26.74% gain over the past week.
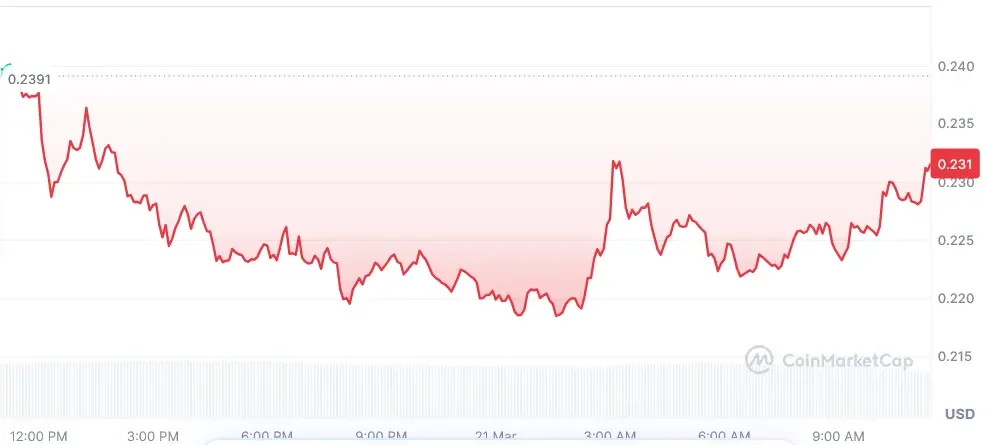
The token is trading at $0.2310, backed by rising market activity. The 24-hour trading volume is $148.84 million, showing a 14.29% daily decline.
Meanwhile, market capitalization stands at $523.38 million, down 3.19% over the same period, as per the CoinMarketCap data.
Also Read: FET Rally Gains Strength as Volume Jumps 93% and Bulls Target $0.45
The FET 4-hour chart shows a clear recovery after a prolonged downtrend, with price forming a strong base near the $0.13–$0.14 zone.
This accumulation area marked the end of wave (2)/C, followed by an impulsive bullish move completing wave (3) structure.
After reaching a resistance point near $0.23, the price is being rejected and is now going through a period of correction, marked as wave (4).
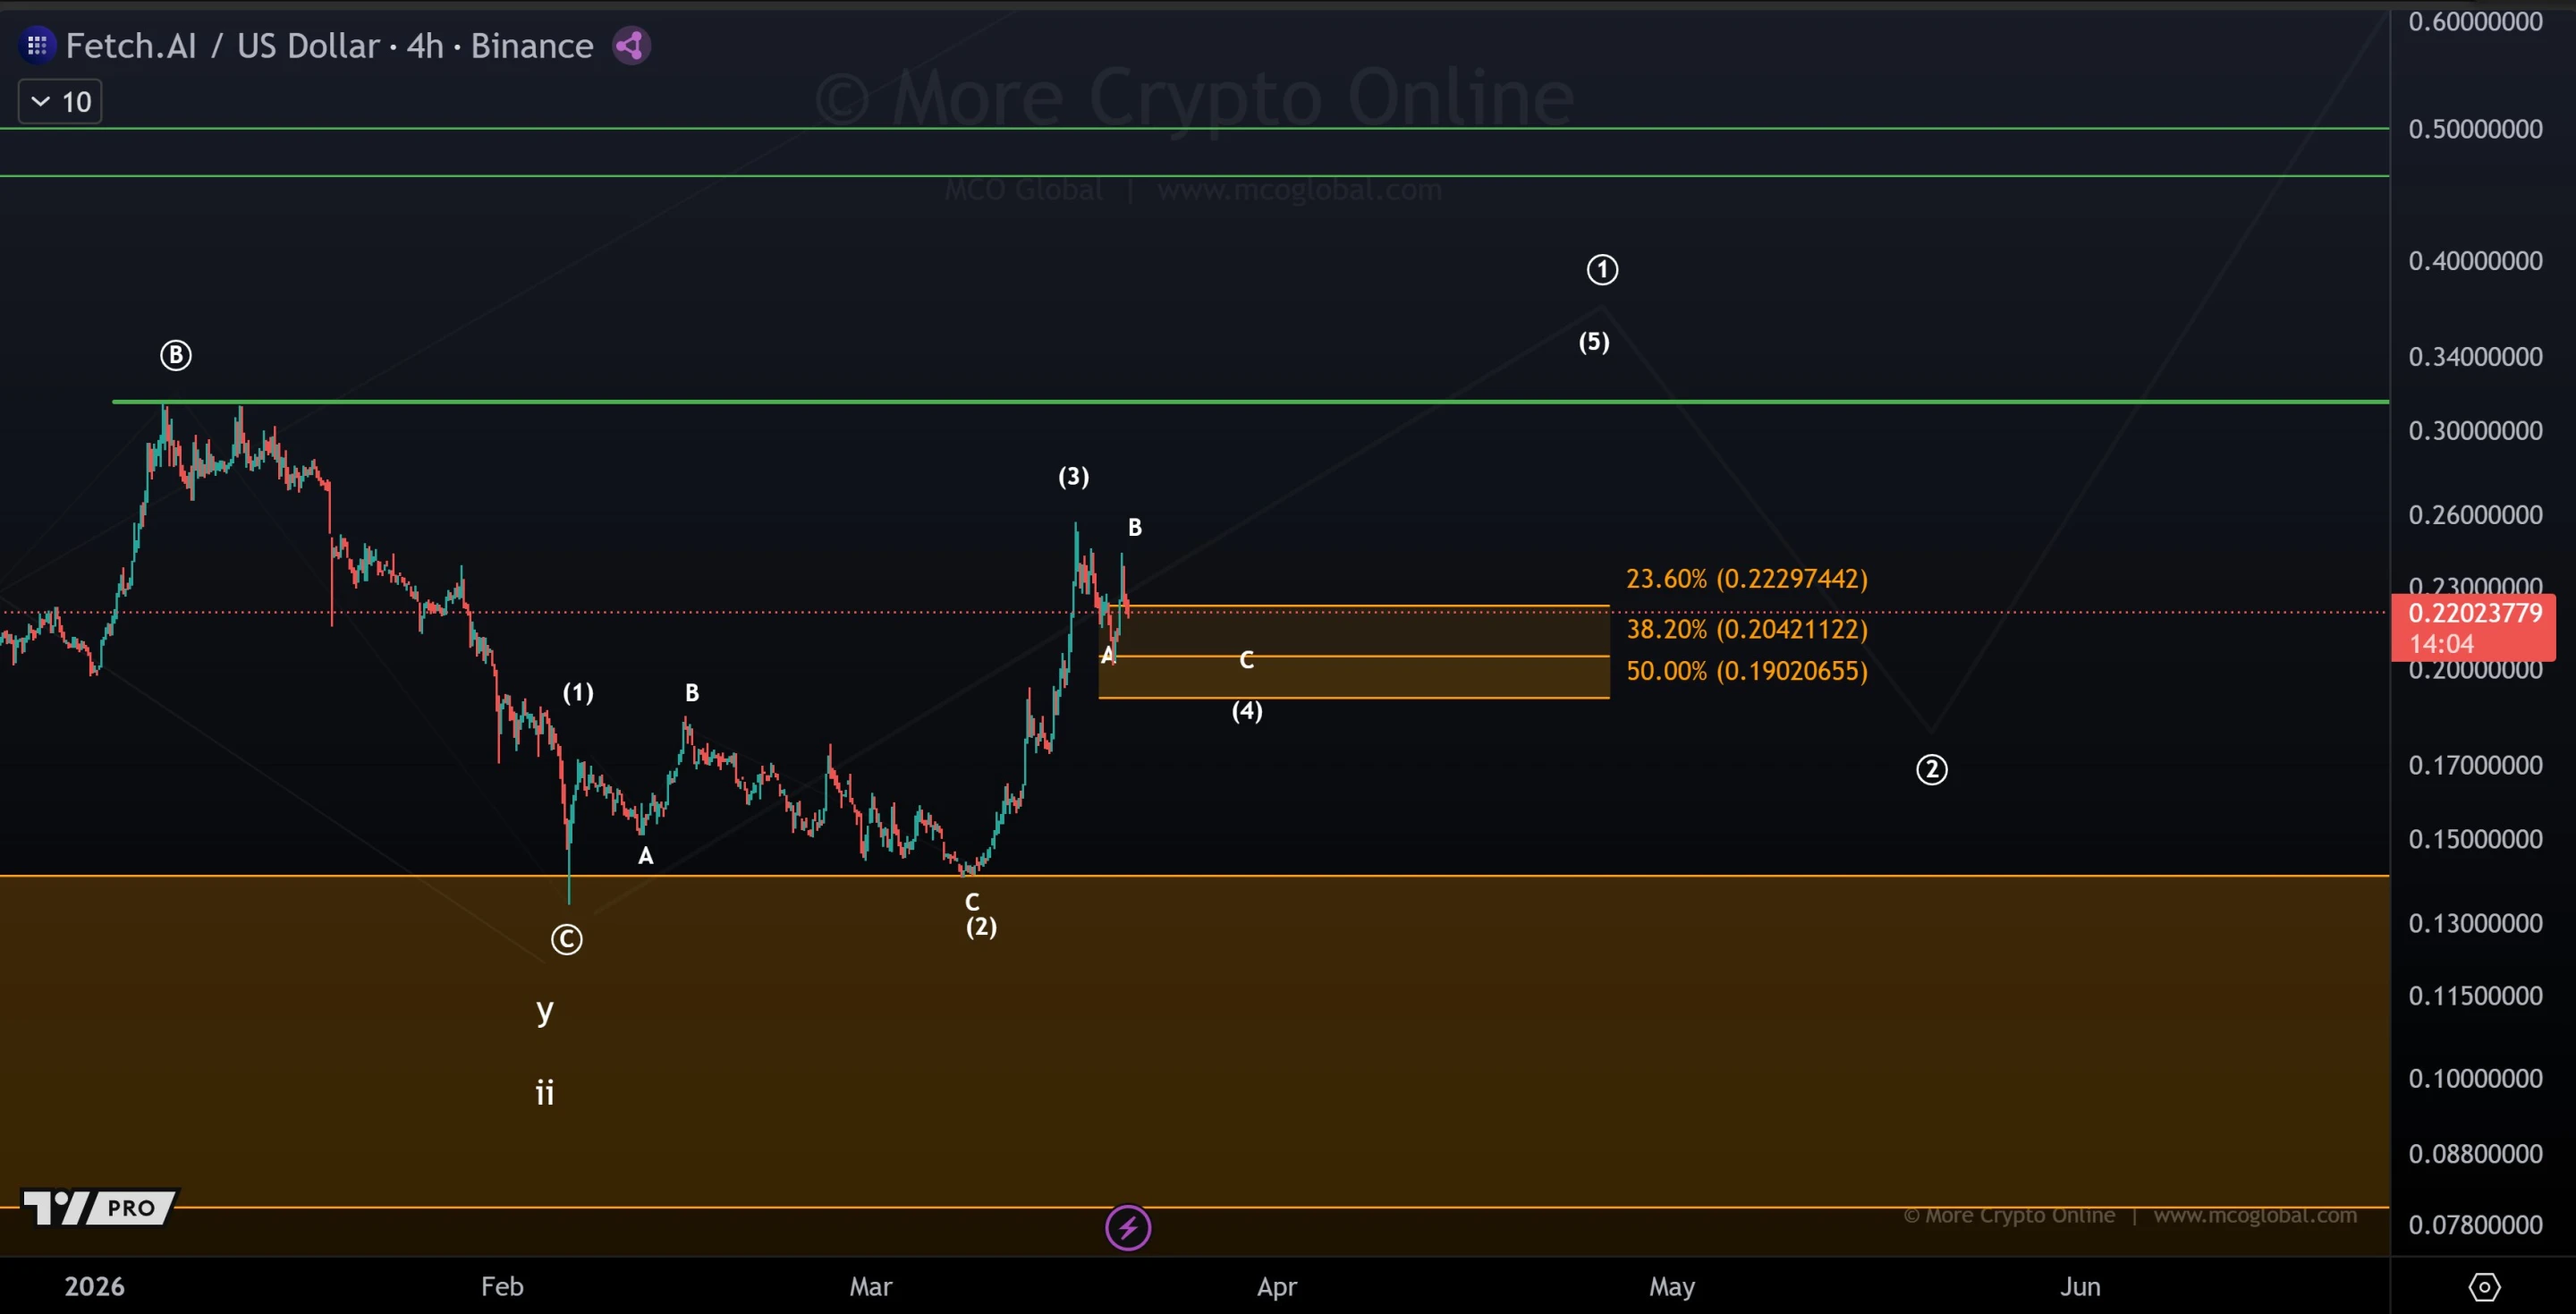
The retracement between $0.204 and $0.190 is a significant point for buyers to enter, as it represents a 38.2% and 50% retracement.
If the price remains above the $0.19 price point and confirms this, a new wave 5 may start, which may take the price to the $0.30 and possibly even the $0.34 to $0.40 resistance levels, according to a crypto analyst, More Online Crypto.
However, if the price drops below this point, the bullish trend may stall, and the price may fall back to the demand zone of $0.15 to $0.13.
As per the TradingView chart, the current level of the RSI is at 67.97, and its moving average is at 60.27, which is a positive sign for the bulls as it is approaching the overbought region.
The increasing trend of the RSI indicates a buying trend, and a slight dip may occur if it faces a barrier at the 70 level.

The MACD indicator indicates a bullish crossover with the MACD line at 0.01693, the signal line at 0.00956, and the histogram at 0.00738.
The increasing size of the green bars indicates a rise in the strength of the uptrend, which confirms a continuation of the current trend. The slowing rate of growth of the histogram may indicate a consolidation phase in the near future.
Investors should monitor the support zone of the $0.204-$0.19 price area to gauge the sustainability of FET’s bullish trend towards the $0.30 target.
Momentum indicators, including RSI and MACD, are also pointing to a possible pullback for FET, enabling traders to plan their investments.
This article contains market analysis and price predictions. These are not guarantees. Crypto markets are volatile. Always DYOR. Not financial advice.
Also Read: FET Tests $0.15 Resistance, Breakout Could Trigger 50% Rally

