
As of April 20, 2026, XRP remains within a tight trading structure as price action continues to compress. Analysts point to a multi-month pattern nearing its apex. Market activity shows rising participation, while key technical levels remain in focus for the next directional move.
As of writing, XRP is trading at $1.40, showing a decline of 1.64% in the past 24 hours. The trading volume has gone up by 23.83% and is currently standing at $3.02 billion. Over the last week, the XRP coin price has increased by 6.31%, according to CoinMarketCap.

Also Read: Ripple (XRP) Shows Bullish Reversal Toward $1.90 After SuperTrend Indicator Flip
Crypto analyst ChartNerd highlighted that XRP remains within a multi-month symmetrical triangle pattern. The structure continues to compress as the price moves closer to its apex. He adjusted the trendlines to reflect candle close levels for better accuracy.
He also noted the 20 and 50 EMAs to monitor the short-term momentum. These averages serve as critical price levels for consolidation. Holding above them continues to be vital to avoid going towards lower support regions.

Moreover, another analyst, More Crypto Online, mentioned that the B-wave rally might have completed. A slightly larger B-wave is still possible. Another test of the micro resistance area could happen. Breaking below the $1.37 level is still probable based on the existing pattern.

As per CoinGlass data, the future volume has increased by 16.99% to $3.72 billion. Meanwhile, open interest fell by 0.96% to $2.60 billion. The OI-weighted funding rate currently sits at 0.0029%, pointing to a slightly positive attitude.
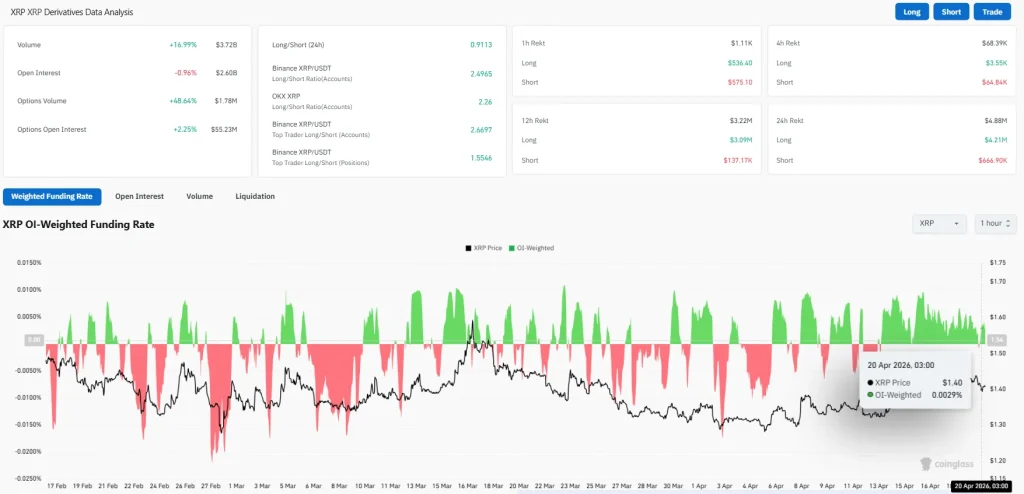
Liquidation data shows recent bearish sentiment towards long positions. The total liquidations amounted to $4.88 million within the last day. Longs were totaled at $4.21 million. Shorts suffered losses of $666.90K during the same period.
On the daily time frame, XRP is trading near its short-term moving averages. Its 20-day EMA is currently at $1.38700 and sits below the current price. It serves as short-term support. Staying above this level will keep the short-term trend intact.
Meanwhile, the 50-day EMA stands at $1.41056 and sits above the current price. This represents short-term resistance. Moving above this level would provide space for higher prices.
Resistance levels remain on higher time frames. The 100-day EMA is currently at $1.54113. Meanwhile, its 200-day EMA is at $1.78907. This provides the upper resistance if the momentum rises.

The Relative Strength Index (RSI) is currently at 53.41. Its RSI moving average is at 52.07. This shows that the indicator remains above the neutral level. This suggests that momentum is steady without any directional bias.
Also Read: Solana (SOL) Holds Support as Correction Signals Move Toward $95

