As of January 19, 2026, Bitcoin trades around $93,000, after a sharp intraday selloff and rebound. The day’s range has been wide, with price wicking down near the low $92,000s and bouncing toward the mid $95,000s.
Two forces define the current tape.
First, macro headlines can still flip crypto into a risk-off move in minutes. Second, leverage remains high enough that liquidations can exaggerate even modest spot selling.
A practical read is that Bitcoin is in a recovery phase inside a larger range: stronger than the recent lows, but not yet back above longer-term trend markers that tend to define sustained uptrends.
The charts below use daily BTCUSD data and common indicators. They are designed to answer three questions:


The latest drop behaves like a classic leverage flush.
Reports tied the move to tariff-driven risk-off pressure and a fast unwind in bullish derivatives positions, with widely cited liquidation totals around the $600 million mark across crypto. When Bitcoin sells off in a short window and rebounds quickly, it often means the marginal seller is not long-term spot holders. It is forced deleveraging.
This matters for forecasting because leverage flushes can reset a market without breaking the broader structure. After a flush, the next move depends on whether spot demand appears at known support zones or whether sellers return once the bounce stalls.
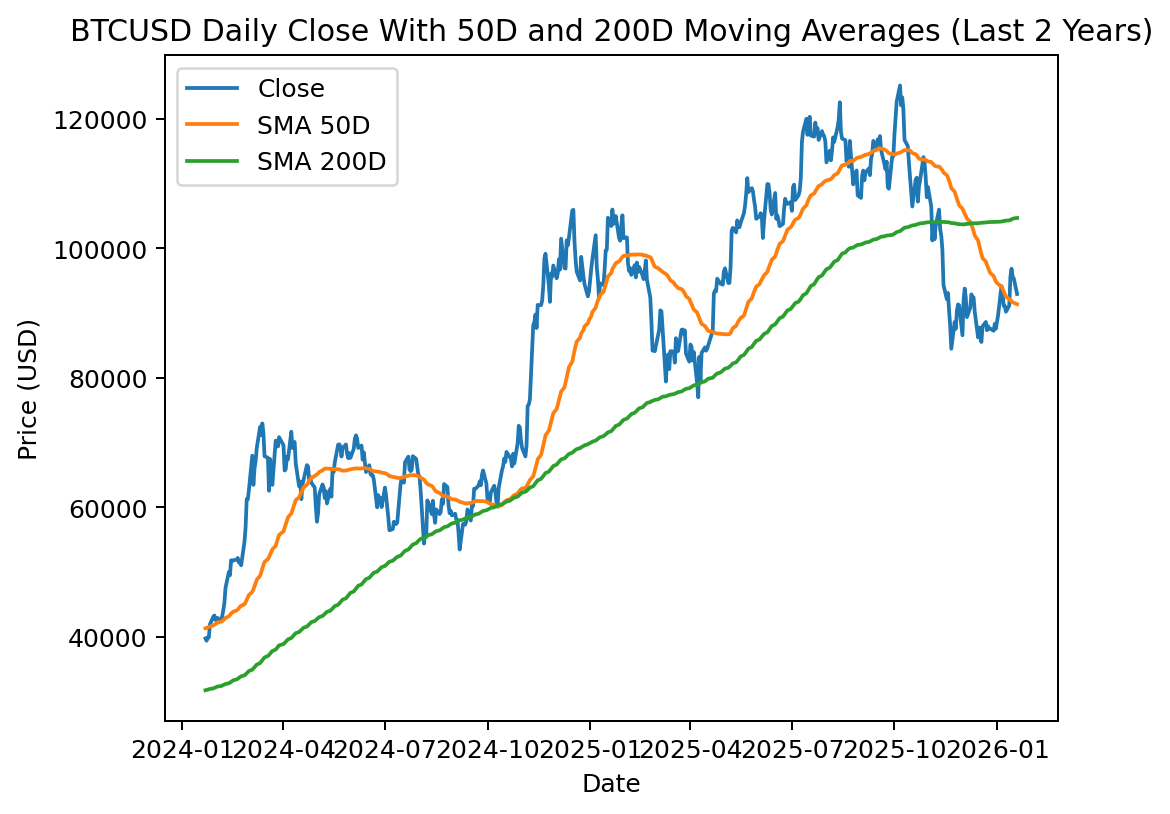
The 50-day moving average sits near $91,391 and the 200-day moving average sits near $104,711, based on the latest daily dataset.
That setup has a clear implication.
Markets often behave differently below the 200-day.
Rallies can be sharp, but they can also fail more often, because sellers use the move to de-risk. A clean reclaim of the 200-day, followed by holding it as support, is one of the simplest technical signals of trend normalization.
RSI(14) sits near 62, which is constructive but not overheated.
A common pattern in sustained uptrends is RSI holding above 40 on pullbacks and pushing toward 70 on rallies. In choppier ranges, RSI often oscillates between 30 and 70 more evenly.
The current RSI read suggests Bitcoin has upside momentum, but it is not flashing an exhaustion signal on its own.
Over the last two years, the maximum drawdown from a prior peak has been about -41%. That figure is not a forecast. It is a reminder of what Bitcoin has historically done even inside strong cycles.
That drawdown chart is useful because it frames risk expectations.
If a market is coming out of a sharp drawdown, it often needs time to rebuild liquidity and confidence. That rebuild can include violent whipsaws, especially around macro headlines.
Technical levels are most useful when they align with psychology, positioning, and liquidity.
A key tell is how price behaves on a retest.
If Bitcoin returns to $90,000 to $92,000 and bounces with rising volume and falling sell pressure, that supports a base-building narrative. If it slices through quickly, it suggests the bounce was mainly short covering.
Breakouts are not confirmed by a single wick.
They are confirmed by closing above resistance, holding it on a retest, and sustaining higher lows.
Leverage is the accelerant in most fast Bitcoin moves.
When funding is positive and open interest is elevated, a down move can liquidate longs, creating an air pocket. When funding turns negative and traders pile into shorts, the reverse happens.
Three derivative signals tend to matter most:
Options commentary from Deribit Insights has highlighted periods where implied volatility trends lower even as macro calendars remain busy. Low volatility regimes can look calm, then snap sharply when positioning gets crowded.
A useful rule of thumb.
If volatility has been compressing and funding is optimistic, a downside wick is more likely to trigger a liquidation cascade. If volatility is elevated and funding is pessimistic, a short squeeze becomes more likely.
Two flow narratives matter right now.
U.S.-listed spot Bitcoin ETFs can influence short-term liquidity, especially during volatile weeks. Recent reporting described ETFs turning back to net inflows, with some coverage pointing to around $1.2 billion in net inflows over a short window.
ETF flows rarely explain every candle, but they can provide a floor effect during dips, especially when macro pressure is not crypto-specific.
For ongoing tracking, many traders reference dashboards like CoinGlass ETF data.
On-chain research frequently becomes a narrative catalyst when it shows large cohorts accumulating during drawdowns.
Recent coverage referencing Glassnode described the Fish-to-Shark cohort adding around 110,000 BTC over a 30-day window, framed as the strongest monthly accumulation since the FTX-era drawdown.
This type of accumulation does not guarantee immediate upside. It tends to matter more as a medium-term signal.
If large holders accumulate while price holds key supports, it increases the odds that dips are absorbed rather than extended.
Forecasting Bitcoin is less about one number and more about scenarios with invalidation levels.
The goal is to define what has to happen for each path to stay plausible.
The scenarios below are structured across three horizons: short-term (days to weeks), medium-term (one to three months), and trend horizon (several months).
Bitcoin chops inside a broad range, with volatility spikes around macro headlines.
A common path is:
Base-case invalidation is a clean breakdown and daily close below the high $80,000s, followed by weak rebounds.
Bitcoin reclaims $95,000 to $97,000 quickly and pushes toward $100,000.
The bull case is supported by:
Bull-case invalidation is repeated rejection at $95,000 to $97,000 paired with falling spot volume and rising sell pressure.
Bitcoin fails to hold $90,000 and revisits the prior range floor.
The bear case is supported by:
Bear-case invalidation is a swift reclaim of $92,000 to $93,000 after a breakdown, with buyers defending the level and forcing shorts to cover.
Bitcoin continues repairing the trend but remains below the 200-day moving average for longer than bulls expect.
In this case, the market rotates capital between majors and narratives, and Bitcoin slowly grinds upward while volatility remains manageable.
This scenario becomes more likely if:
Bitcoin reclaims the 200-day moving average and holds it as support, shifting market structure from repair to expansion.
The clearest technical confirmation is:
If that happens, $100,000 becomes less of a ceiling and more of a staging area.
Bitcoin remains stuck in a broad range, then breaks down as macro conditions tighten.
This scenario can unfold even with positive long-term fundamentals if liquidity gets pulled from risk assets.
A bearish medium-term structure usually includes:
Over several months, Bitcoin tends to be driven by three variables:
Because those variables can change quickly, a practical longer-term forecast is probability-based.
Forecasting improves when it focuses on levels, structure, and invalidation, not perfect targets.
A typical decision maker, such as a treasury manager or high-conviction investor, often uses a simple rule set.
This is a framework, not a recommendation. It exists to reduce impulsive decisions during volatility.
Bitcoin looks constructive above the 50-day moving average, but the longer-term trend still needs repair while price remains below the 200-day.
The $90,000 area matters because it is both psychological and close to the recent wick zone. The 50-day region around the low $91,000s is a second key reference.
A bullish breakout is usually confirmed by closing above resistance, holding it on a retest, and forming higher lows. A clean reclaim and hold of the 200-day moving average is a commonly watched confirmation.
Liquidations force traders to close positions, creating additional market orders. That can turn a normal dip into a fast cascade and exaggerate volatility.
ETF flows can influence liquidity and sentiment, but they rarely explain every move. Macro conditions, leverage, and spot supply-demand still matter.
Bitcoin is trading in a recovery structure: above the 50-day moving average but still below the 200-day. RSI momentum is constructive, while recent price action shows leverage-driven volatility that can trigger fast wicks and sharp rebounds.
The near-term focus is whether support around $90,000 to $92,500 holds on retests. The medium-term pivot is whether Bitcoin can reclaim and hold the 200-day moving average near the $104,000 to $106,000 area.
Scenario-based forecasting suggests a wide trading range remains plausible, with a bullish path opening if the 200-day is reclaimed and defended, and a bearish path opening if the range floor breaks and fails to recover.
The post Bitcoin Price Analysis and Forecast appeared first on Crypto Adventure.