XRP Price Prediction: Is XRP Ready to Hit $2 in 2026?

10-May-2026 CryptoTicker.io News

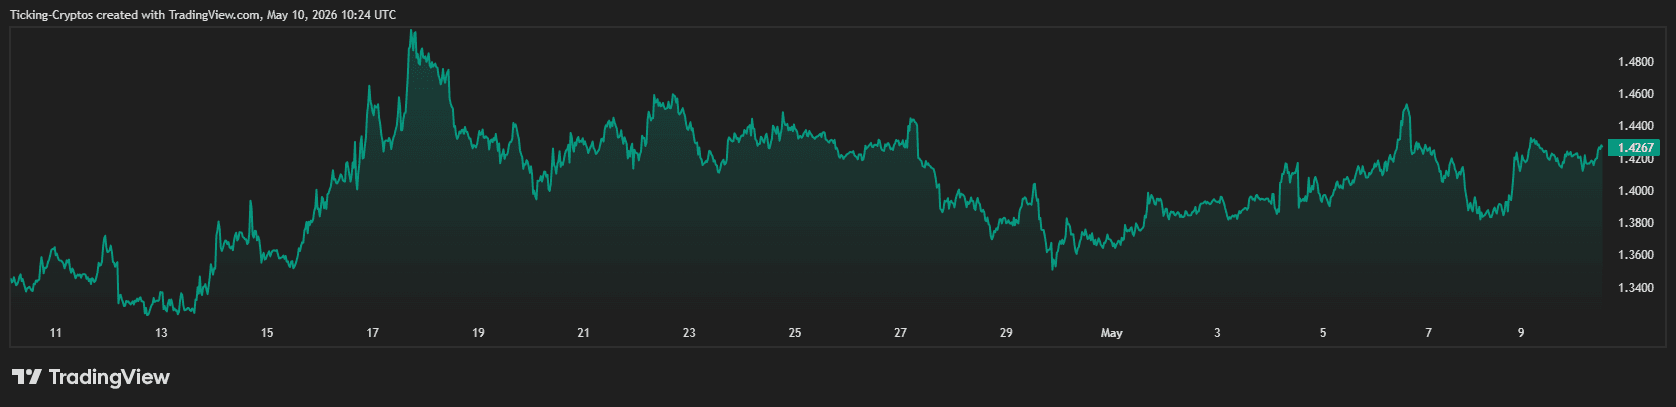
As of May 10, 2026, XRP is trading around $1.4291, showing a recovery from the early-year lows. With the SEC lawsuit firmly in the rearview mirror since the 2025 settlement, the narrative has shifted from "will it survive?" to "how high can it scale?"

XRPUSD_2026-05-10_13-24-46.png
XRP Price in USD over the past month

Is it a Good Time to Buy XRP?

Determining if it is a "good buy" depends on your horizon. Currently, XRP is consolidating just above the $1.40 psychological level. For long-term investors, the entry at these levels is attractive because the asset is backed by:

  • Spot XRP ETFs: With over $1.53 billion in AUM across seven US ETFs, the "wall of money" has arrived.
  • Legal Clarity: The removal of the SEC overhang allows US exchanges and banks to integrate XRP without fear.
  • Institutional Adoption: Ripple’s partnerships with giants like Kyobo Life and Intesa Sanpaolo for on-chain settlement provide fundamental utility that few other tokens possess.

How High will XRP Reach in 2026?

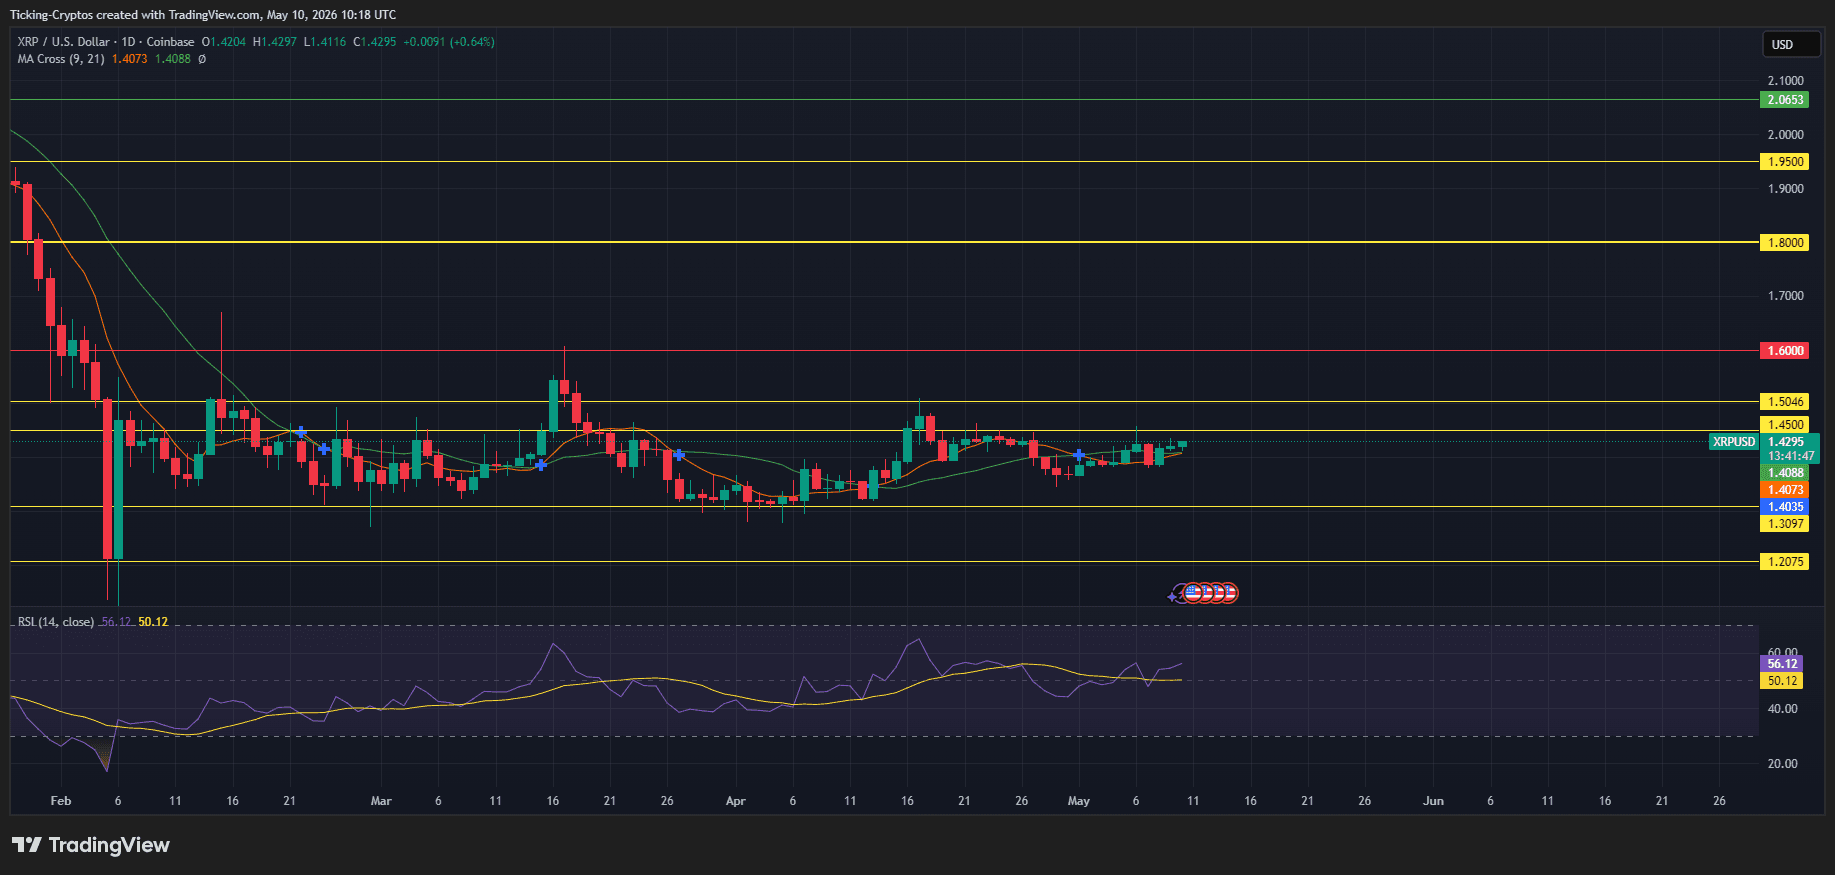
The $2.00 mark isn't just a round number; it represents a full structural recovery and a gateway to the 2025 all-time highs of $3.66. To reach $2.00 from the current $1.42, XRP needs a 40% rally. Given the current daily volume and the steady ETF inflows (averaging $80M+ monthly), this target is technically within reach by Q3 or Q4 of 2026.

XRP Technical Analysis: Support and Resistance Areas

Looking at the 2-hour and daily charts provided, we can identify the specific "battlegrounds" for traders.

XRPUSD_2026-05-10_13-16-31.png

1. Immediate Support: The $1.35 Floor

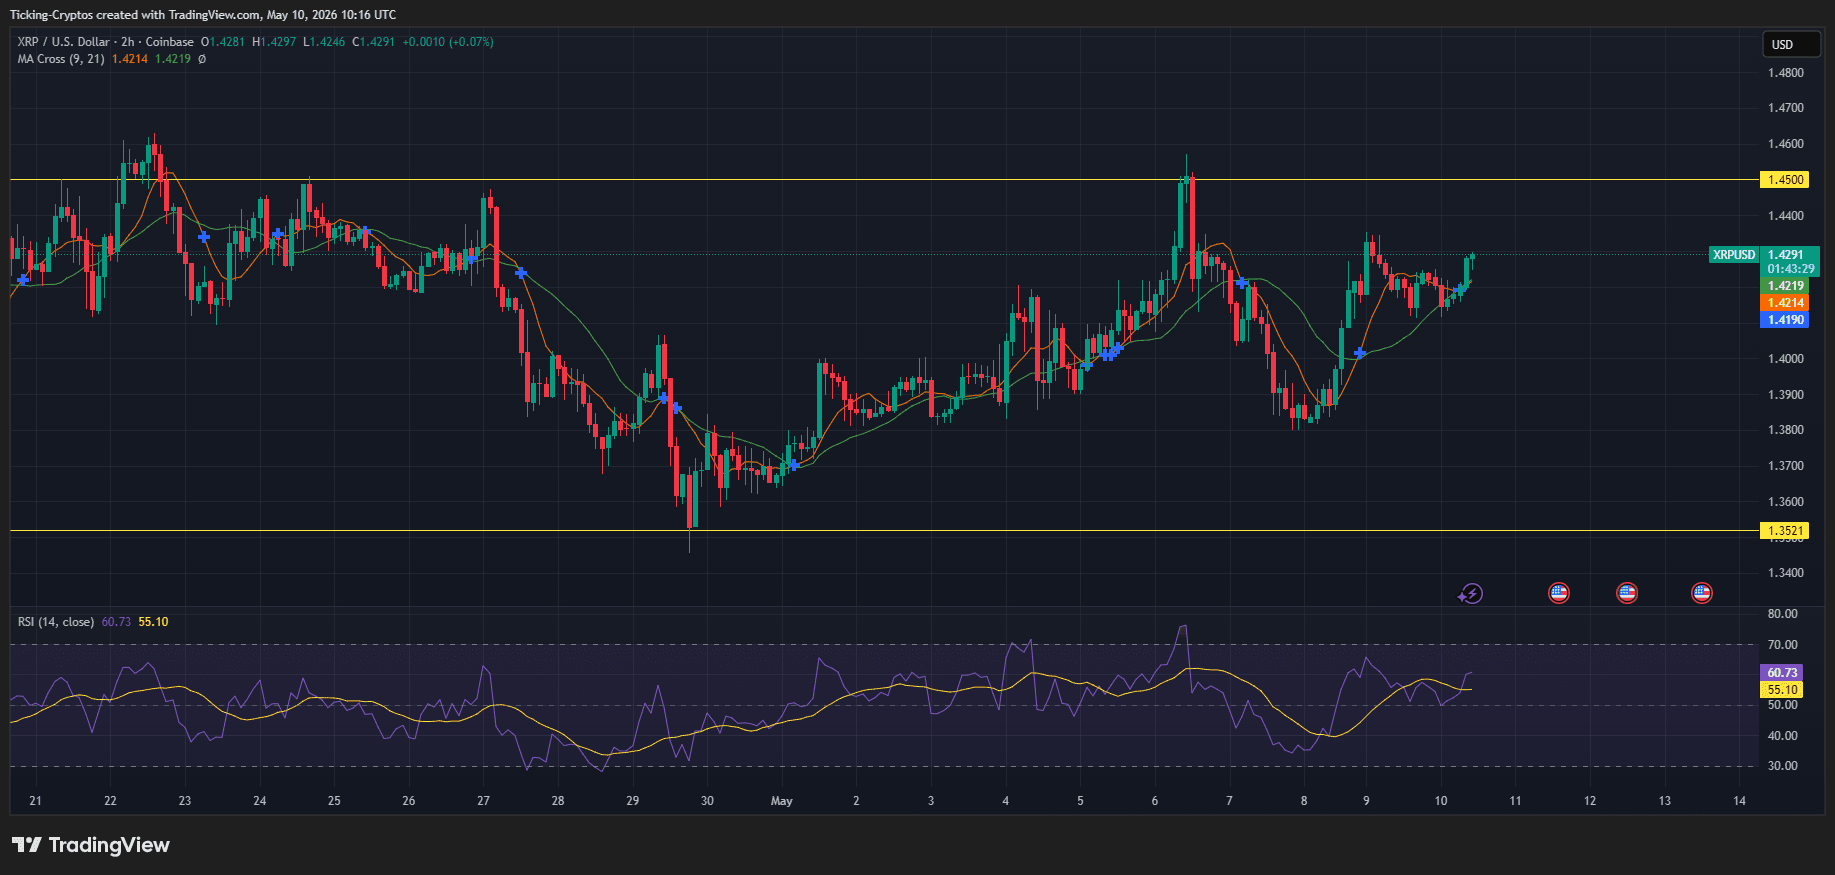
The 2-hour chart highlights a primary support zone at $1.3521. This level has historically acted as a springboard for recent bounces. If XRP face a correction, bulls must defend this area to prevent a slide back to the $1.20 range.

  • MA Cross: The 9-day and 21-day Moving Averages are currently hovering around $1.40 - $1.42, acting as dynamic support in the short term.

2. The $1.45 "Breakout" Resistance

$XRP is currently bumping its head against a yellow resistance line at $1.4500. As seen in the daily chart, a daily candle close above this level would signal a "cup-and-handle" breakout.

XRPUSD_2026-05-10_13-18-13.png

  • RSI Check: The RSI (14) is sitting at 60.73. This indicates bullish momentum but leaves enough "overbought" room for a push higher toward the next major hurdle.

3. Critical Resistance: $1.60 and $1.85

  • $1.60: This is the mid-range target. Passing this would likely trigger FOMO (Fear Of Missing Out) among retail traders.
  • $1.85 - $1.88: This area aligns with the 200-day Moving Average. This is the ultimate "bull vs. bear" line. Reclaiming the 200-MA would practically guarantee a run to $2.00 and beyond.

XRP Price Levels in 2026

Level TypePrice PointSignificance
Major Resistance$2.00Psychological and structural target
Mid Resistance$1.60Confirmation of bull trend
Immediate Resistance$1.45Current breakout zone
Current Price$1.4291Consolidation phase
Immediate Support$1.35Local floor
Strong Support$1.20Long-term accumulation zone
Also read: BTC Holders Lock In 14,600 Coins as Price Rally Tests Three-Month Peak
About Author Lorem ipsum dolor sit amet, consectetur adipiscing elit. Nunc fermentum lectus eget interdum varius. Curabitur ut nibh vel velit cursus molestie. Cras sed sagittis erat. Nullam id ante hendrerit, lobortis justo ac, fermentum neque. Mauris egestas maximus tortor. Nunc non neque a quam sollicitudin facilisis. Maecenas posuere turpis arcu, vel tempor ipsum tincidunt ut.
WHAT'S YOUR OPINION?
Related News