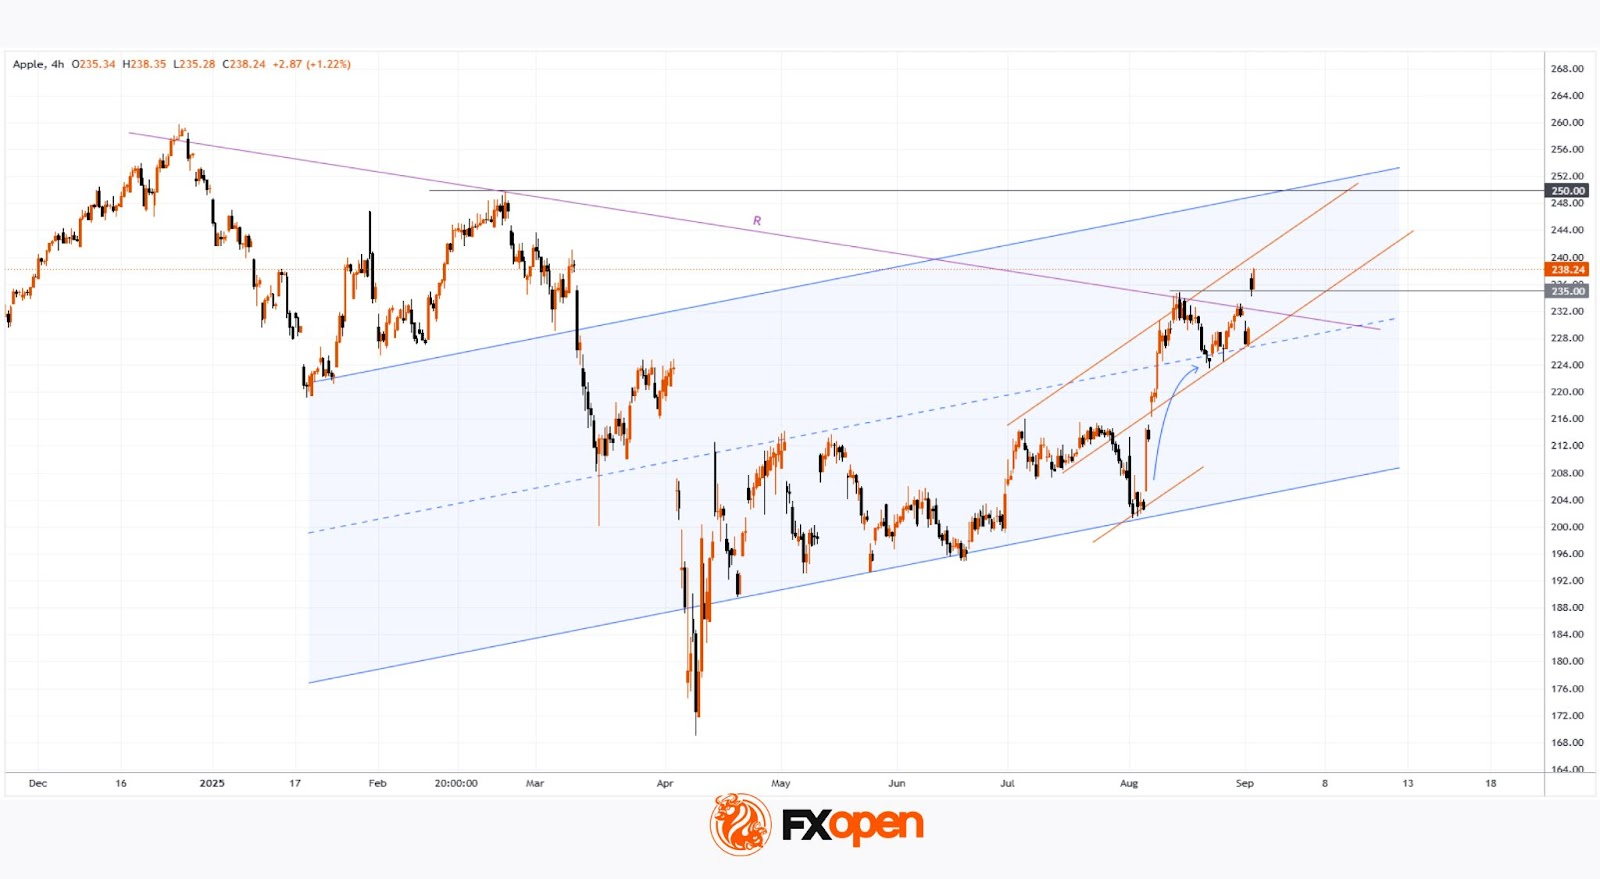
As the AAPL chart shows, yesterday the price rose above $238 – its highest level since early March.
The optimistic sentiment was fuelled by:
→ A court ruling concerning Google, which we reported on yesterday. Apple shares advanced after the court allowed Alphabet to continue paying Apple for preloading Google Search on the iPhone. Bank of America analysts even raised their AAPL price target to $260.
→ The upcoming Apple presentation scheduled for 9 September. Expectations are that the event could unveil the iPhone 17 and new Apple Watch models, which may provide a bullish catalyst.
Technical Analysis of Apple (AAPL) Stocks
Analysing the chart in early August, we:
→ identified an ascending channel (shown in blue);
→ noted that, given the aggressive rally (accompanied by bullish gaps) and a strong fundamental backdrop, any corrections were likely to be limited.
Since then:
→ AAPL has moved higher, justifying the expansion of the blue channel;
→ the pullback (marked by an arrow) was minor, as expected, confirming the median line of the expanded channel as support;
→ in the short term, we could identify grounds for a new upward trajectory (shown in orange).
Yesterday’s price action in AAPL:
→ produced a wide bullish gap at the open (which may act as support);
→ broke through the long-term descending trendline (R), which had been acting as resistance;
→ indicated that the $235 level (around the August high) now functions as support.
Within this context, we could assume that:
→ in the short term, AAPL may maintain its upward trajectory within the orange channel;
→ in the longer term, bulls may target the upper boundary of the blue channel – located near the psychological $250 mark. Reaching this level could trigger stronger selling pressure.
In the event of a significant correction (for example, due to disappointment with new product launches), potential support levels could include:
→ the median of the blue channel;
→ the trendline R.

