
As the AUD/USD chart indicates, the Australian dollar is showing weakness against the US dollar at the start of the week. Notably, we are seeing a bearish breakout below the lower boundary of an important ascending channel that had been in place since December 2025.
Among the key bearish factors:
→ increased demand for the US dollar as a safe-haven asset amid the United States’ involvement in large-scale military actions against Iran. US President Donald Trump has threatened strikes on Iranian power infrastructure if the Strait of Hormuz remains closed, while Tehran has warned of potential attacks on key US and Israeli facilities;
→ a decline in Asian equity markets, which are sensitive to disruptions in energy supplies from the Middle East. In turn, the value of the Australian dollar is closely tied to commodity exports from Australia to China;
→ traders’ expectations ahead of inflation data due to be released on Wednesday.
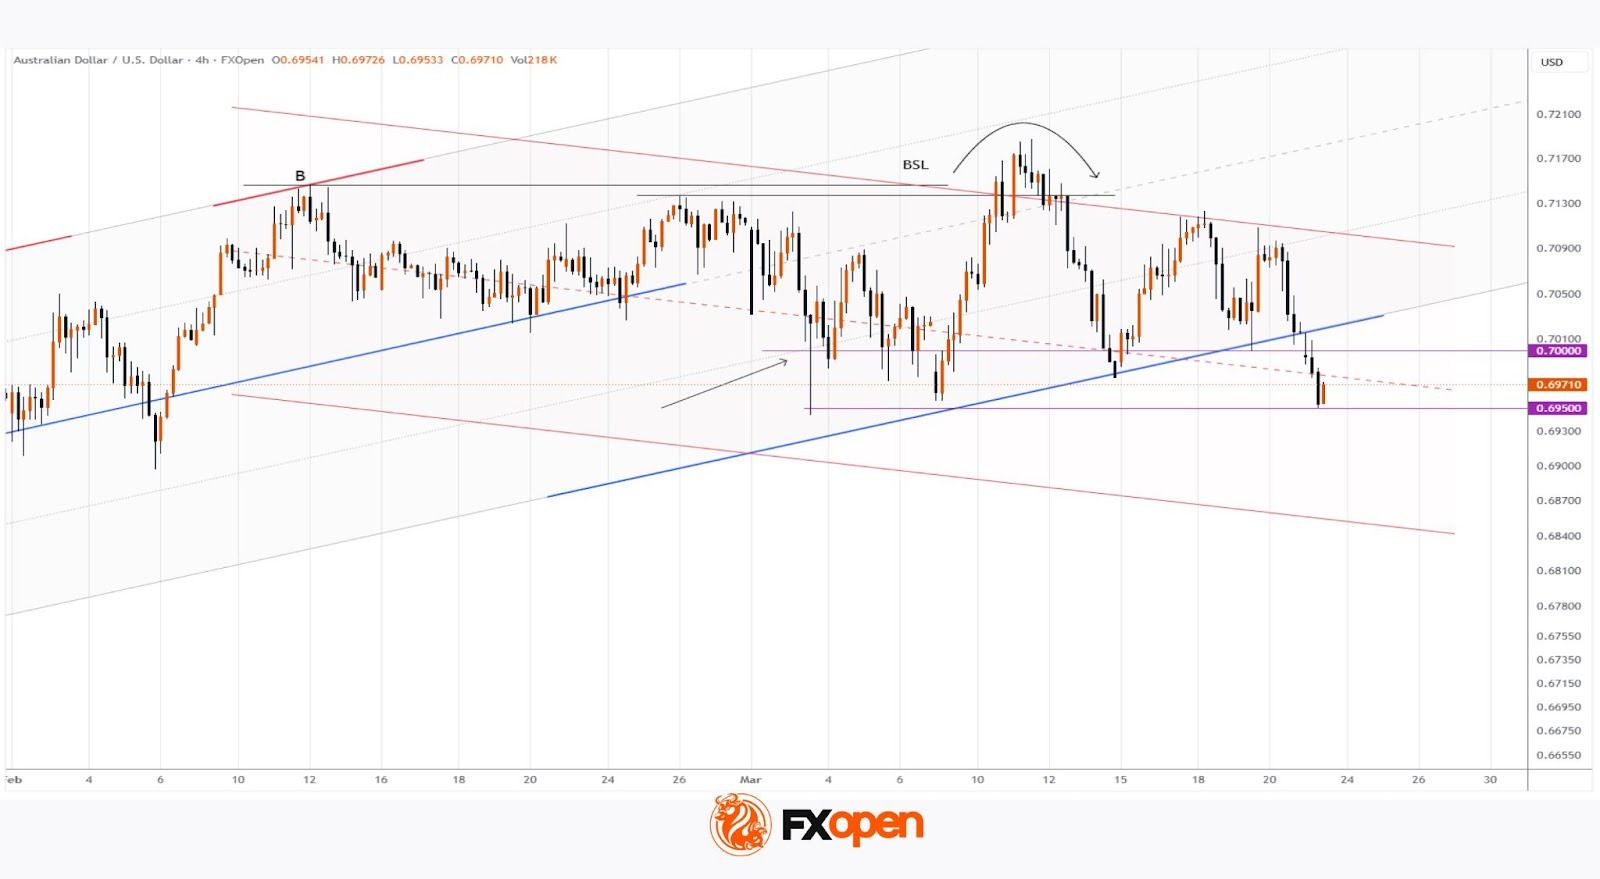
On 24 February, we confirmed the validity of the ascending channel, within which we:
→ identified signs of weakness during the formation of highs A and B;
→ suggested a potential break below the channel median with a move towards the psychological level of 0.7000.
Indeed, the price failed to surpass high B and moved into the lower half of the channel in early March. As shown by the first arrow, on 3 March it briefly dipped below the psychological 0.7000 level before quickly rebounding, signalling strong demand.
However, the underlying weakness near highs A and B persisted. Between 10–12 March, bulls attempted to break through these resistance levels but failed to hold above the new high. From a Smart Money Concept perspective, this resembles a liquidity grab in the buy-side liquidity (BSL) zone — a bearish signal.
In the short term, a rebound from the March low (around 0.6950) is possible. However, when considering a broader outlook, traders should not rule out:
→ the 0.7000 level turning into resistance;
→ further development of a downward trend within an increasingly well-defined descending channel.

