
As the chart shows, Tesla (TSLA) stocks are displaying strong market momentum. In particular, the price:
→ is above the psychological level of $400;
→ has reached its highest levels since late January;
→ has gained around 25% since the beginning of September.
Why Is TSLA Rising?
The main news driving the price surge was a media report that Elon Musk had purchased $1 billion worth of Tesla stock. The market interpreted this as commitment and confidence in the company’s future from its founder, which sharply increased demand for the shares.
Other factors contributing to TSLA’s rise include:
→ Expectations of a Federal Reserve interest rate cut to stimulate the economy. This makes growth stocks such as Tesla more attractive to investors.
→ Reduced tensions between Elon Musk and President Trump’s administration. This removes some of the political risks that had weighed on the stock.
Technical Analysis of TSLA Stock
In our August analysis of the TSLA chart, we:
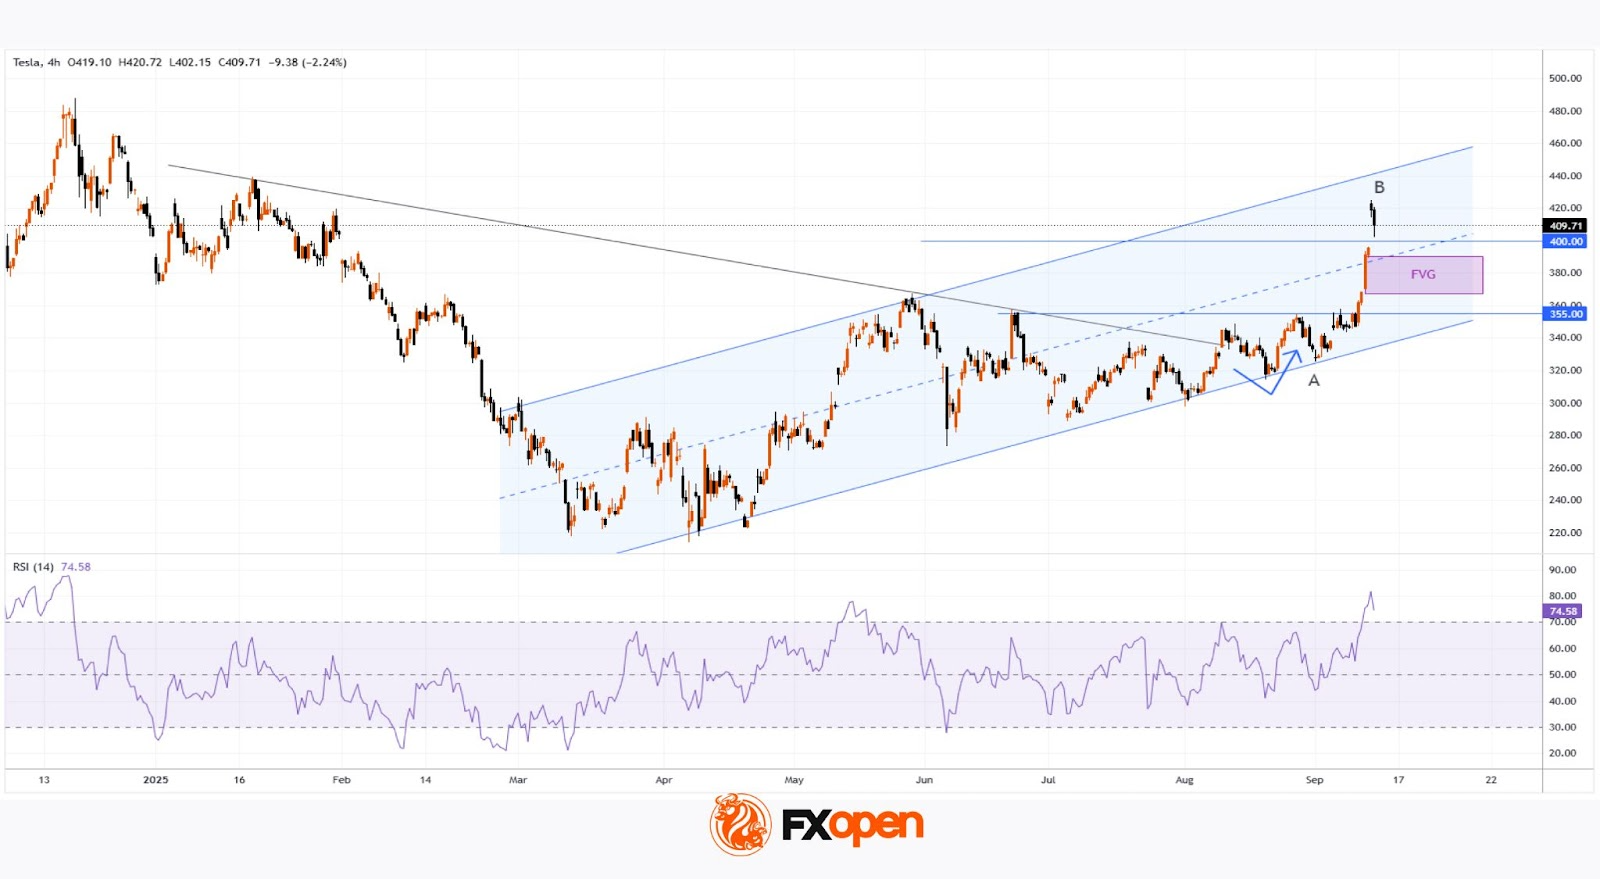
→ noted that the price had broken through the upper boundary of a broad contracting triangle with its axis around $317;
→ suggested that a correction might follow after the rally in early August.
Since then:
→ the price made a minor pullback before reversing upwards (as shown by the arrow);
→ the bullish trend resumed, providing anchor points to construct a rising (blue) channel.
Thus, the chart confirms:
→ a shift in sentiment in favour of buyers;
→ an improving fundamental backdrop (as highlighted in the news) and growth prospects linked to robotaxis and other innovations.
From a bullish perspective, the breakout of $355 followed by accelerated growth points to strong demand.
From a bearish perspective:
→ the RSI indicator has spiked into overbought territory;
→ the price is near the upper boundary of the rising channel;
→ the seven-month high could prompt profit-taking by investors – already reflected in yesterday’s pullback.
Taking this into account, we could assume that while the long-term outlook remains optimistic, a correction is possible, for example:
→ towards the 50% retracement level of the A→B impulse;
→ into the price expansion zone (a bullish imbalance signal, as described by the Fair Value Gap pattern in the Smart Money Concept methodology).


