
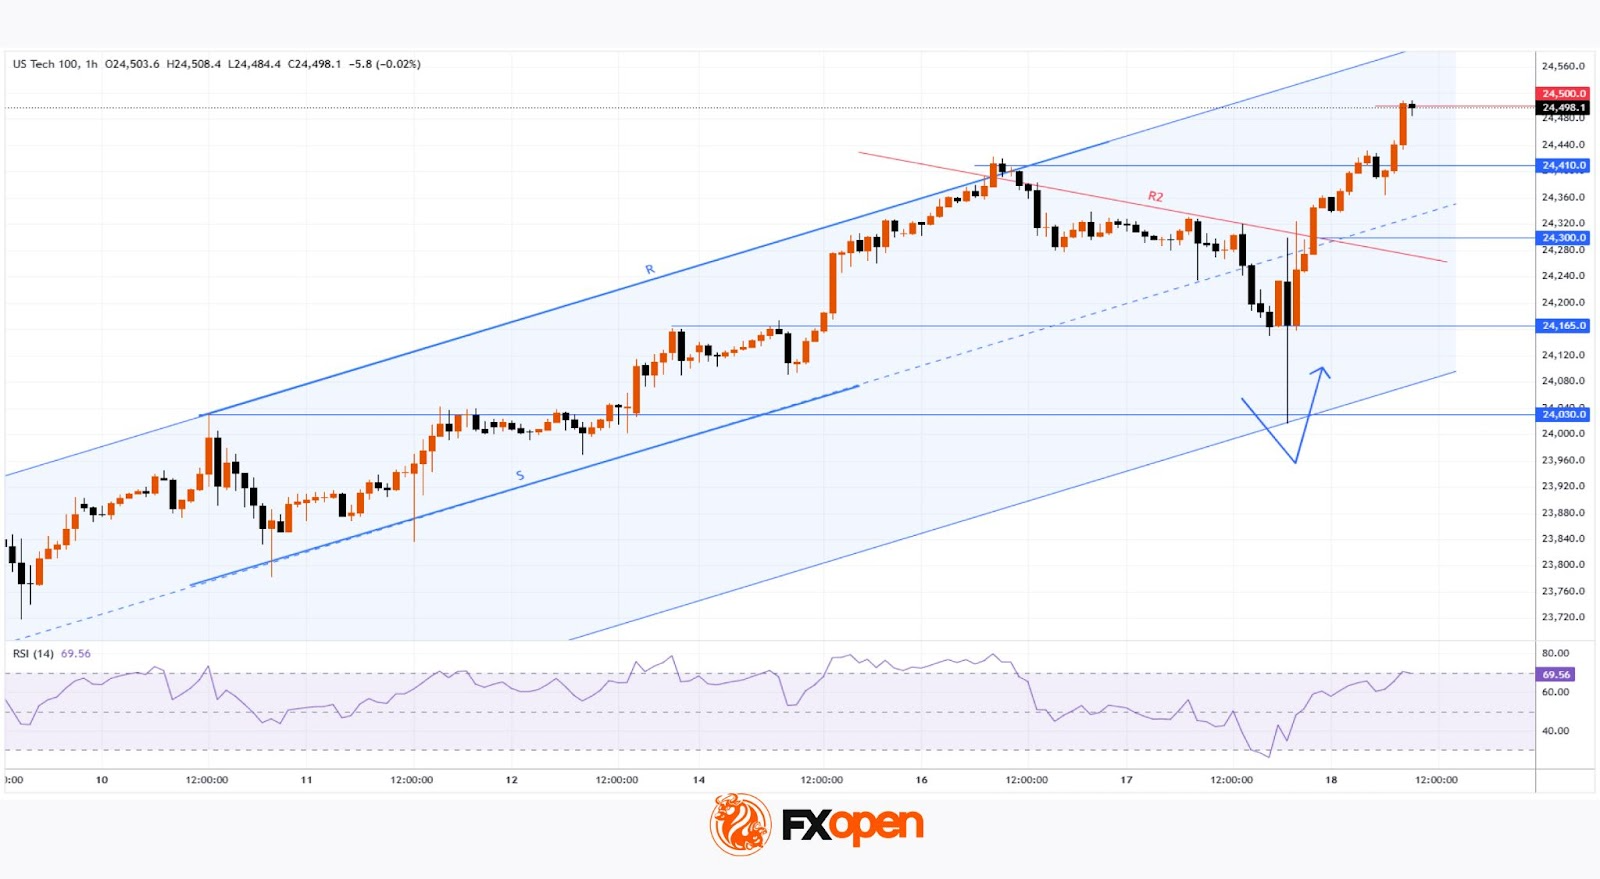
As the chart shows, today the Nasdaq 100 index (US Tech 100 mini on FXOpen) has, for the first time in history, climbed above the 24,500 level.
According to media reports, bullish sentiment was driven by the long-awaited Fed decision to cut interest rates for the first time in 2025.
Although the Fed also indicated it would remain cautious about further cuts, the easing acted as a bullish catalyst for the entire stock market – European equities also advanced today, with technology companies leading the way.
Technical Analysis of the Nasdaq 100 (US Tech 100 mini on FXOpen)
When looking at the Nasdaq 100 index (US Tech 100 mini on FXOpen) within the context of the September rally (highlighted by the blue channel), we note the following:
→ In mid-September, price action reflected market optimism, as the index traded in the upper half of the channel – with resistance at the upper boundary (R) and support at line S.
→ Yesterday’s volatility spike produced a similar move (marked with an arrow) to the one we highlighted in today’s earlier gold analysis, namely a sharp reversal from the lower boundary of the channel (essentially a bullish engulfing pattern, albeit less clear due to volatility and the chosen timeframe).
Following the reversal from the lower boundary, which unfolded aggressively (a sign of bullish conviction), the price advanced steadily, breaking through key levels:
→ the midline of the blue channel;
→ the R2 resistance line shown in red;
→ the former all-time high at 24,165.
Moreover, the index’s behaviour around 24,300 demonstrated the persistence of buyers – the price moved above a cluster of local resistances and then extended its rally.
Bearish view:
→ bullish momentum has pushed the RSI indicator into overbought zone;
→ when attempting to break above the psychological 24,500 level, the price failed to hold, suggesting a false bullish breakout.
Given the above, we could assume that optimism prevails in the market, supported by the Fed’s decision:
→ on the one hand, further gains towards the upper boundary of the blue channel may take place;
→ on the other hand, the market may be overheated and vulnerable to a correction (for instance, back towards the blue midline).

