As the S&P 500 chart (US SPX 500 mini on FXOpen) shows, this morning the price approached yesterday’s high at A, but then sharply reversed downward (indicated by the arrow), forming a lower low at B.
This resembles a Double Top pattern, which can be interpreted as market indecision near the all-time high. Traders are weighing risks and opportunities that depend on US actions in Venezuela:
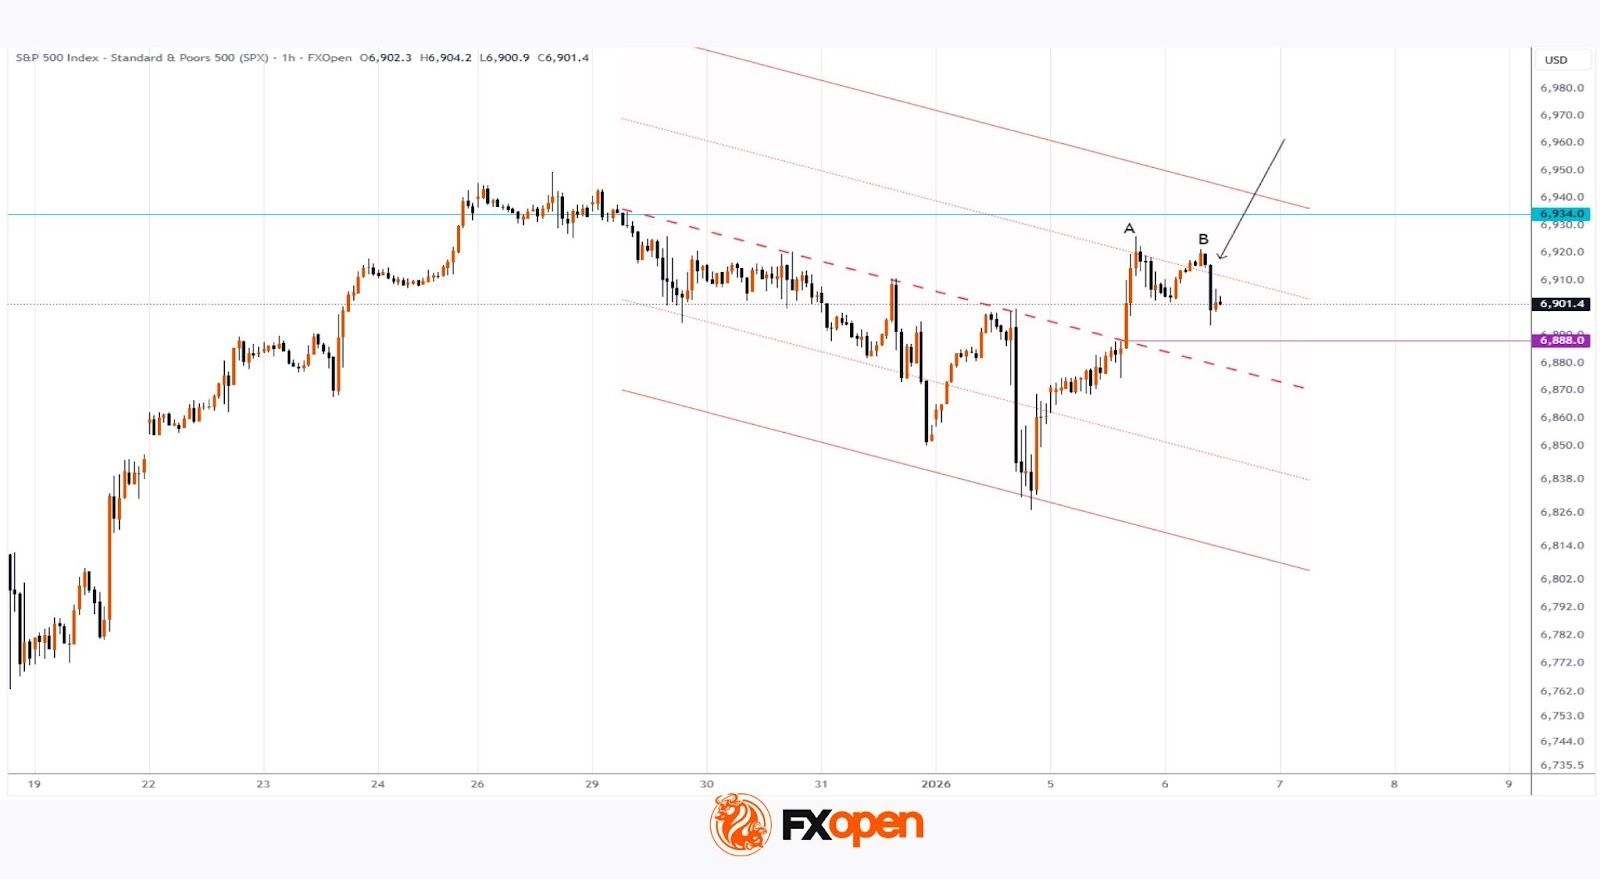
E-mini S&P 500 Technical Analysis
On 29 December, we noted the indecision of bulls around the 6934 level, as the price showed no signs of firmly holding the record highs. We also considered a scenario in which the S&P 500 (US SPX 500 mini on FXOpen) might decline.
Since then, the trend has largely been bearish, and a descending channel can be drawn, with:
This level may act as support for bulls on their way toward the upper boundary of the channel.
On the other hand, a bearish break of the 6888 level:

