
Avalanche’s native token, AVAX, is now live inside the Solana ecosystem through Sunrise, marking a new step in cross-chain DeFi integration.
Users can access and use AVAX directly in Solana apps, including Phantom, Solflare, Titan Exchange, DFlow, and Fomo, enabling smoother asset movement and expanding interoperability between two major high-performance blockchain networks.
The integration brings new liquidity opportunities to Solana while allowing AVAX holders to explore additional DeFi tools without leaving their preferred ecosystem.
By reducing the need for complex bridging, the launch improves user experience and reflects a growing industry trend toward stronger blockchain connectivity, shared liquidity, and broader multi-chain decentralized finance adoption.
Also Read: AVAX Decline Signals Bullish Reversal, Long-Term Target Set at $120
Following this major integration, the AVAX price has also surged. According to the crypto analyst Clifton Fx, AVAX is making its way to a crucial resistance as it attempts to break free from a downward trend line on the daily chart.
The trend line has kept the asset within a range of lower highs and lower lows, but a close above the trend line with good strength is expected to change the trend for the asset.
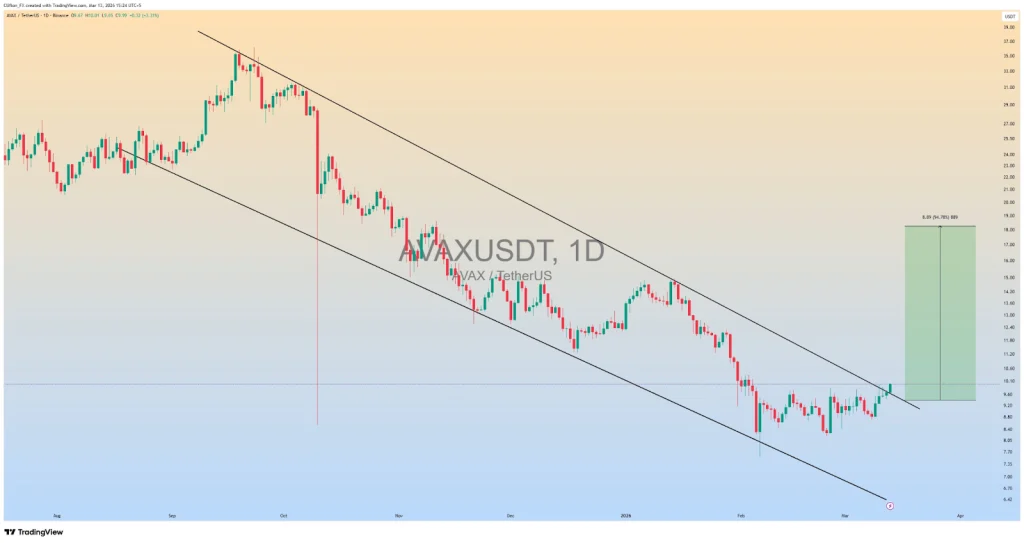
Source: Clifton Fx’s X Post
A breakout can trigger a strong rally to $18, a significant resistance level set by the past market high. Renewed interest in layer 1 blockchains and a more stable crypto market are fueling the positive sentiment.
However, a lack of a breakout can mean the asset may trade sideways within its current range. The daily chart movements will be important to gauge the chances of the bulls taking control.
According to TradingView, the RSI is at 59.04, reflecting a steady rise from its previous lows. Since its current RSI is above the 49.06 signal line, it indicates a rise in buyer confidence without going into an overbought state.
In general, when the RSI is in a middle state, it indicates a potential for further price appreciation as the market digests its recent price action and turns more bullish.

Source: TradingView
The MACD indicates a bullish crossover as the blue line is 0.0096 units above the orange line. At the same time, the histogram is in the green region, indicating that the downward momentum experienced in early February has lost its effect. The technical analysis implies that the trend is rising since both lines indicate a further upward trend.
This article contains market analysis and price predictions. These are not guarantees. Crypto markets are volatile. Always DYOR. Not financial advice.
Also Read: AVAX Shows Early Recovery Signals as Avalanche Trades Near $9


