
Binance Coin (BNB) is approaching a key support zone near $585 after facing a strong rejection around the $660 resistance level.
According to the crypto analyst Crypto Pulse, as of Sunday, March 8, the pullback follows a failed attempt to break above the upper boundary of its recent trading range. This decline places the asset back at a crucial level where buyers have previously stepped in to stabilize the price.

Source: Crypto Pulse’s X Post
If bulls successfully defend the $585 support, BNB could see renewed buying momentum and attempt another rally toward the $660 range high.
However, a breakdown below this level may increase selling pressure and signal a shift in market structure, potentially opening the door for deeper corrections in the short term.
Also Read: Binance Coin (BNB) Under Pressure: Bearish Break at $570 Next?
According to TradingView, as of Sunday, March 8, BNB has a clear bearish trend due to the significant fall from the $900 mark in early February.
Currently, the token is stuck at the $616 mark, unable to break through the 20-day EMA resistance level of $633. This is a sign of indecision in the market, as the buying pressure is unable to push the token out of the falling trend.

Source: TradingView
This conservative view is also supported by technical indicators, as the price is held between the middle and lower bands. The relative strength index also remains depressed, indicating no bullish pressure.
With the 200-day EMA far above at $807, the overall macro picture remains heavy. Sideways action will continue until a high-volume breakout above the $653 resistance.
Currently, the relative strength index of BNB is at 41.74, which shows a neutral-to-bearish bias as the RSI is below the midline of 50 points.
This shows that while the cryptocurrency is not oversold, the recent bullish run has slowed down as the RSI is moving horizontally to depict the consolidation between the resistance and support levels.
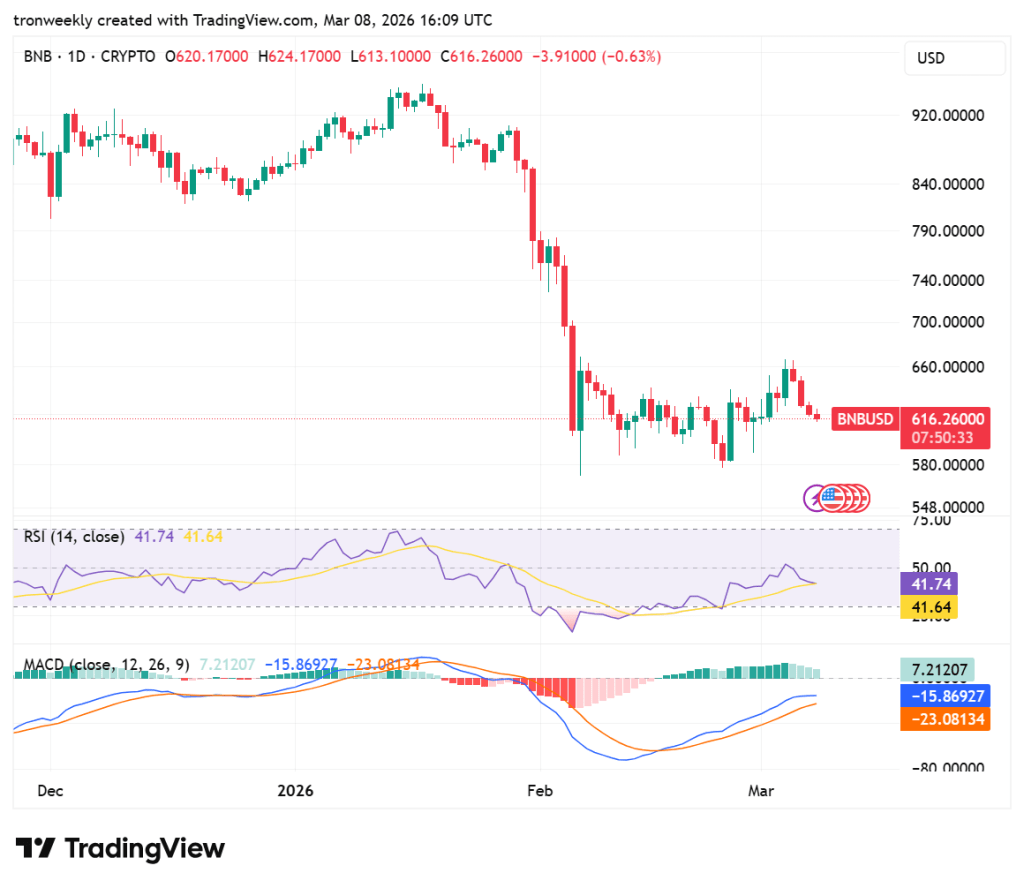
Source: TradingView
The MACD has a bullish crossover as the blue line moves above the orange line, and the green histogram bars are positive.
However, the blue and orange lines are very low on the chart, at -15.86 and -23.08, respectively. This implies that the current uptrend for BNB is not a long-term trend but rather a weak correction.
Also Read: Binance Coin (BNB) Rebounds From $570 Support as $635 Breakout Looms

