
Binance Coin (BNB) is currently displaying some positive growth, although it is in the consolidation phase, according to a crypto analyst, who has stated that the coin has a cautious short-term outlook, although it has a bright long-term outlook.
At the time of writing, BNB is trading at $644.59, having a trading volume of $1.28 billion over the last 24 hours, with a market capitalization of $88.10 billion, based on data from CoinMarketCap. The token is also up by 2.27% over the last 24 hours, signifying a slight increase in price within a period of overall stability.
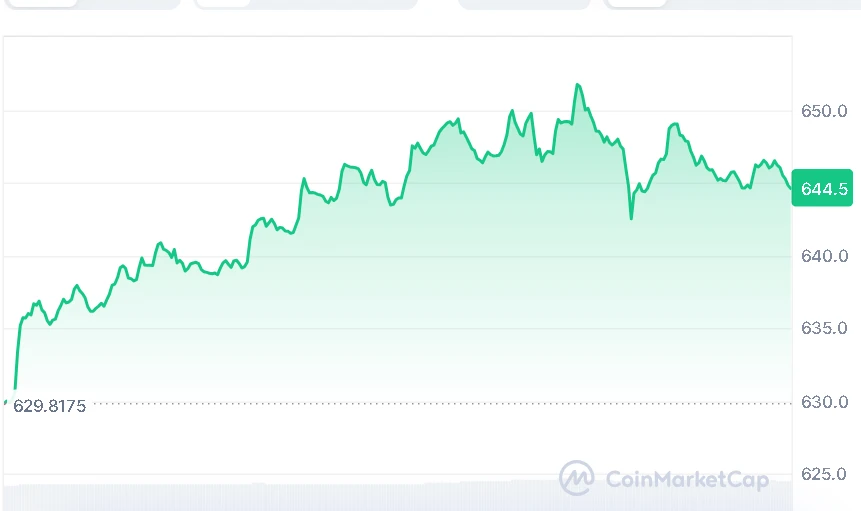
Source: CoinMarketCap
In a post shared on X (formerly Twitter) on March 25, 2026, crypto analyst Crypto Patel pointed out that BNB is currently about 53% away from its all-time high, which might imply growth possibilities. According to Patel, based on price pattern and chart formation, BNB might be positioning itself for a major move in the next altcoin cycle.
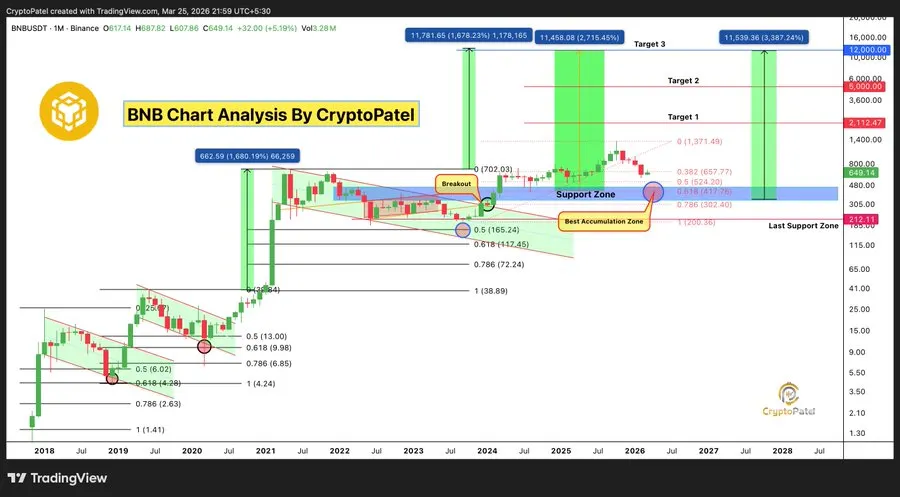
Source: Crypto Patel’s X Post
Significant factors supporting this theory include increased adoption, consistent token burning, and a strong fundamental base for the Binance ecosystem.
Based on the above factors, Patel has predicted an accumulation range between $300 and $420 and further predicted long-term targets for the asset at $2,000, $5,000, and even $10,000 under optimal market conditions.
Also Read | XRP Rally Potential: Break Above $1.50 May Open Path to $1.70
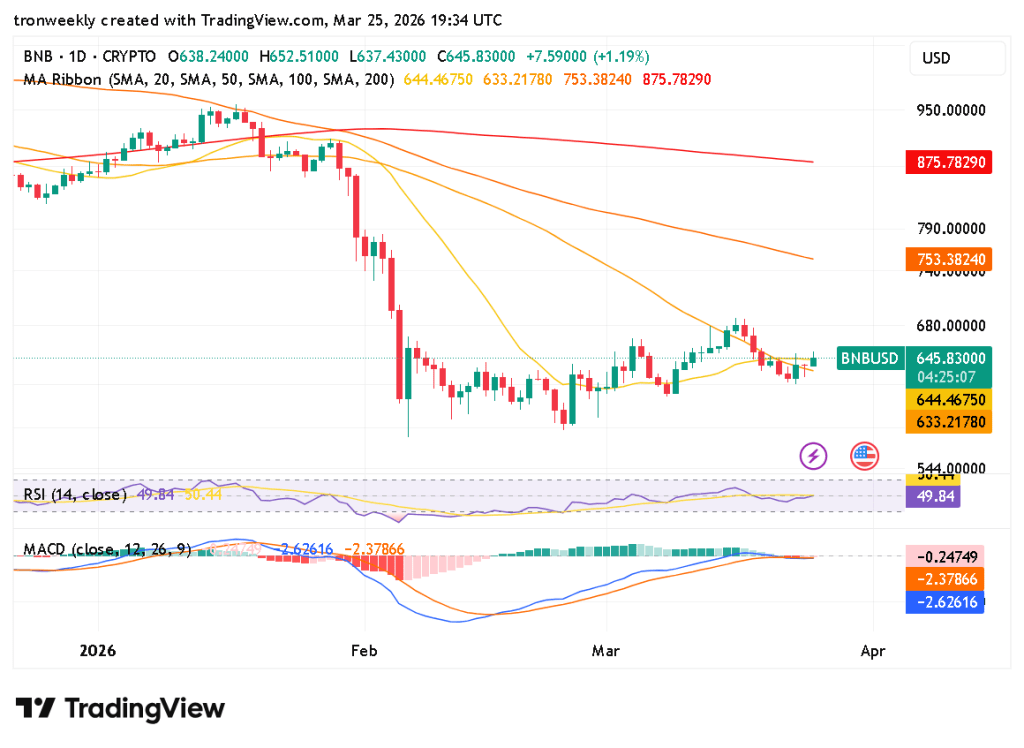
Although the long-term outlook is positive, the short-term momentum is still weak. The RSI is at 49.84; this is a neutral reading with no buying pressure. The price is also close to the 20-day SMA at $644.46 and slightly above the 50-day SMA at $633.21.
However, the overall trend is still under pressure. The stock’s moving averages at 100 days and 200 days are $753.38 and $875.78, respectively, well above the stock’s current price. This indicates that a strong upward trend is still awaited.
Source: TradingView
Meanwhile, the Moving Average Convergence Divergence (MACD) indicator still reflects negative momentum for the stock. The MACD line remains at -2.62, still below the signal line at -2.37. Though the histogram is starting to flatten, a bullish sign has still not been seen.
Overall, the short-term movement of BNB may imply a period of stability; however, the long-term forecast that is being indicated by the analysts still remains a focus for investors within the crypto space as a possible indicator for a stronger upward movement.
This article contains market analysis and price predictions. These are not guarantees. Crypto markets are volatile. Always DYOR. Not financial advice.
Also Read | Best AI Tools Transforming Crypto Marketing and Content Creation in 2026


