Bitcoin appears to be nearing a potential technical turning point as analyst John Bollinger points to a “W”-shaped double-bottom pattern forming on the daily chart. In a fresh set of posts on X, Bollinger argued that the setup is “perfectly fractal,” suggesting the market could be moving into the final phase of a longer bearish cycle.
The technical discussion is landing alongside evidence that institutional demand may be cautiously reappearing. Data shared by market participants indicated that US spot Bitcoin ETFs recorded their first net inflows in ten days, while traders noted that BTC’s ability to hold near the $60,000 area despite broader outflows may signal absorption of selling pressure.
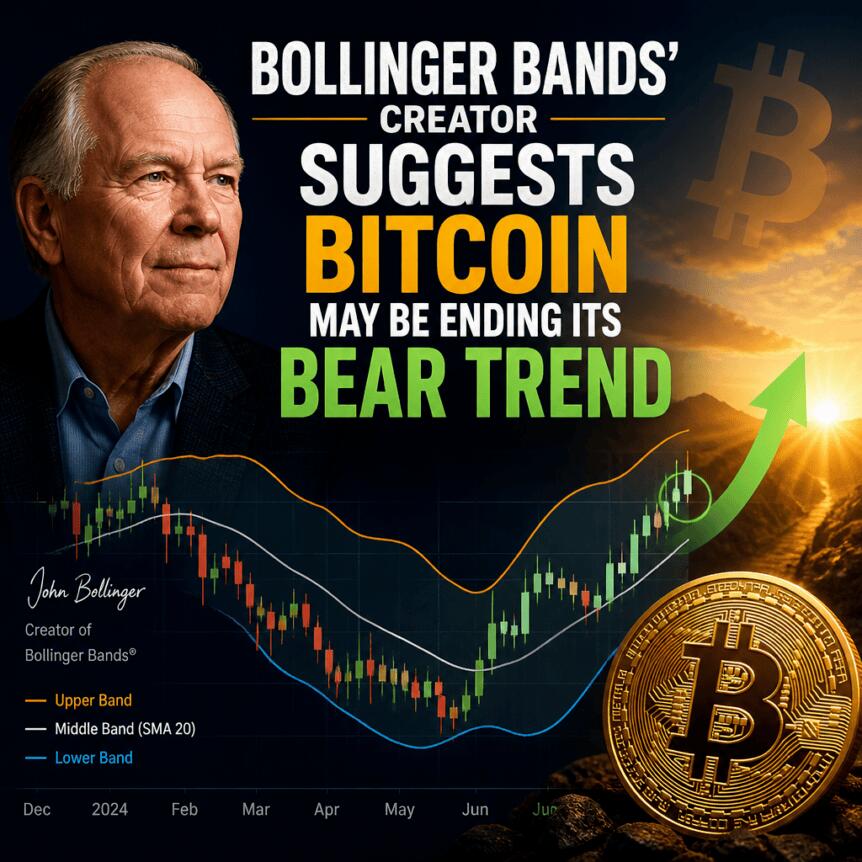
Bollinger, known for creating the Bollinger Bands volatility indicator, used X to examine the current BTC/USD structure. He pointed to a “W”-shaped reversal pattern—typically defined by two swing lows with a rebound in between—arguing that such formations become bullish once price clears the level of resistance created at the rebound.
In his posts, Bollinger noted that prior bullish patterns had been broken, reinforcing his view that the downtrend has been dominant. He then asked whether the present “W” could be the one that “breaks” the trend.
Bollinger also shared a chart aligning the setup with the lower Bollinger Band on daily time frames. He emphasized the fractal nature of the structure, stating that smaller “w” shapes appear at the nadirs and a smaller “m” forms near the apex of the bounce. He further referenced a similar “W” on the weekly chart, implying the idea is not only limited to the daily timeframe.
For traders, the practical question is what counts as confirmation. In classical pattern terms, the bullish outcome hinges on BTC pushing through the rejection level between the two lows. Until that occurs, the pattern remains a hypothesis rather than a verified reversal.
While Bollinger’s analysis is technical, the accompanying focus on ETFs reflects how institutional flows are often used as a real-time indicator of demand. According to market participants on X, US spot Bitcoin exchange-traded funds recorded their first net inflows in ten days on Friday.
Analyst Axel Adler Jr., a contributor to onchain analytics platform CryptoQuant, characterized the move as meaningful for gauging whether ETF-related pressure is easing. In his summary, Adler Jr. said that Bitcoin may be in the late stage of the bear cycle, but the ETF segment had, for the first time, signaled reduced pressure.
Another trader, Daan Crypto Trades, responded by cautioning that the inflow amount—reported as $220 million—was “not massive.” Still, he suggested the context matters: BTC had been holding roughly the $60,000 region even while there were many outflows. In his view, the area becomes more relevant if price continues to bounce further into the next week, since that would imply a larger amount of “absorption” has taken place.
This is an important distinction. In bearish phases, inflows can be sporadic and not necessarily change the broader trend. The market impact tends to be clearer when price holds and demand persists rather than appearing briefly.
Even with renewed interest in ETF flows, the broader market narrative still points to uncertainty about when the macro bottom will arrive. Earlier coverage cited by the same discussion noted that multiple price indicators have been flashing signals not seen since the 2022 bear market. However, many participants continue to believe the next macro bottom is still ahead, with timing expectations pointing to Q3 or later.
Bollinger’s framing fits into that wider tension between “early signals” and “final bottoms.” A W-shaped reversal, if it plays out as expected, would suggest momentum could shift sooner than the macro timetable implies. But without confirmation—especially a breakout through the pattern’s rejection level—the setup could also end up failing or only triggering a temporary bounce within a longer downtrend.
From an investor perspective, that makes the coming price action particularly consequential. If BTC can hold near the reclaimed levels mentioned in the ETF discussion and then follow through on a breakout, the technical pattern could align with improving demand. If not, it may reinforce the view that market participants have not yet reached the stage where bearish pressure fully dissipates.
The next phase will likely depend on whether BTC can translate ETF inflows and near-$60,000 stability into sustained upside, particularly through the key resistance level implied by Bollinger’s “W” structure. Readers should watch for actual confirmation of the pattern—rather than relying only on improving signals—and track whether institutional demand remains supportive beyond this first inflow after a ten-day stretch.
This article was originally published as Bollinger Bands’ creator suggests Bitcoin may be ending its bear trend on Crypto Breaking News – your trusted source for crypto news, Bitcoin news, and blockchain updates.

