
Bitcoin (BTC) is stable above the $72,000 level and is starting to exhibit early strength as some technical signals start to improve. Bitcoin is slowly gaining upward traction, but resistance lines remain on its path to further growth.
At the time of writing, Bitcoin is trading at $72,138, increased by 1.45% over the past 24 hours. According to CoinMarketCap, it has recorded a daily trading volume of $46.27 billion and a market capitalization of $1.45 trillion.
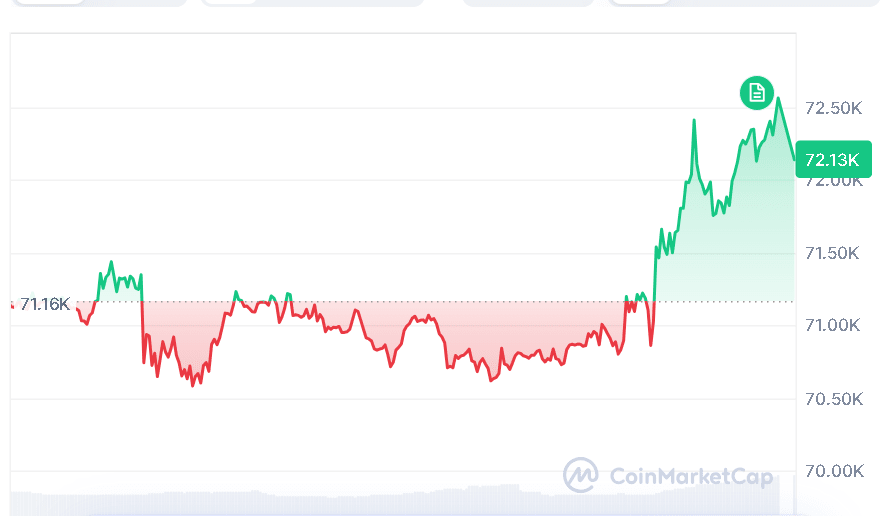
Source: CoinMarketCap
Also Read | Fake Ledger App on Apple Store Wipes Out 5.92 Bitcoin Retirement Savings
One crucial aspect of the market at the moment includes having several CME gaps on the chart. A well-known crypto analyst, Ted, pointed out, that there were three CME gaps on Bitcoin’s price chart.

Source: Ted’s X Post
These gaps include one that lies above the current level of about $73,200. This can serve as a short-term objective should Bitcoin move higher. In addition, there are two other gaps below the current level, around $69,500 and $67,200. These have been known to be visited by Bitcoin in the past.
From a technical perspective, there is mild bullishness in Bitcoin. The current RSI stands at 57.44, reflecting a balanced situation with more scope for gains. The RSI is above its signal line of 52.45, implying that there is still some buying momentum. This implies a steady increase as opposed to a rally.
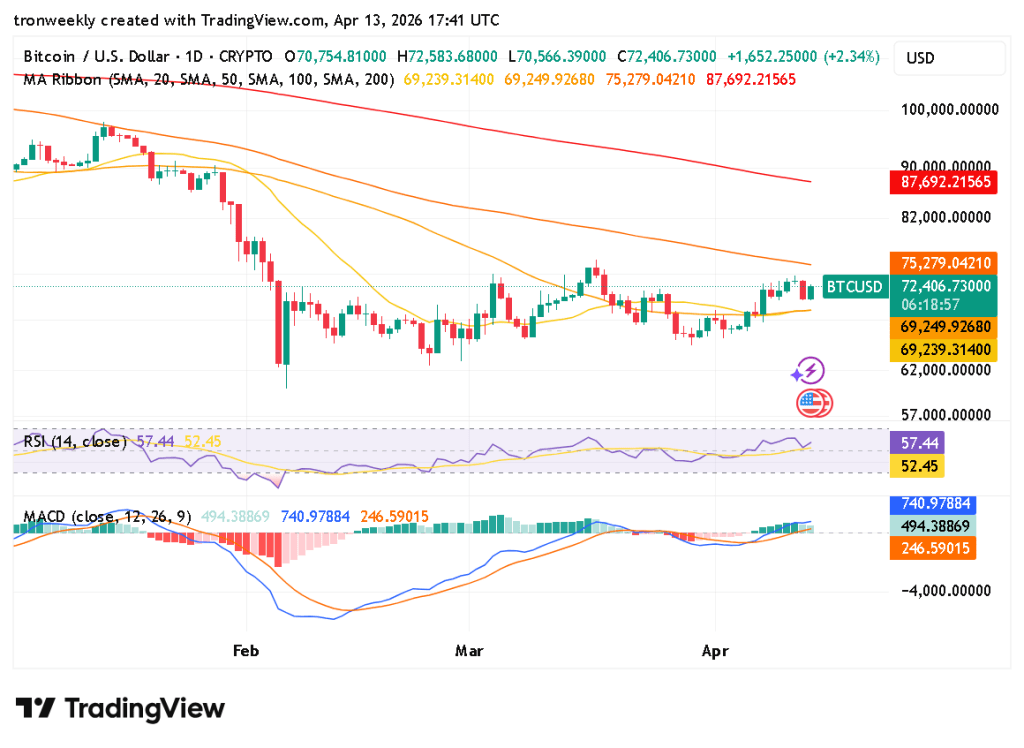
Source: TradingView
Bitcoin’s current price is slightly above its recent price range of $69,200-$69,400 but below important long-term levels such as the 100-day SMA of $75,279 and the 200-day SMA of $87,692. This indicates that while the short-term outlook is improving, the broader trend has yet to fully shift upward.
Momentum oscillators are becoming increasingly constructive towards a slow uptrend. The MACD reading is positive, and the MACD line is at 740.97, which is higher than the signal line at 246.59; moreover, the histogram has turned to positive levels. That is indicative of rising momentum, yet the momentum is not very strong.
Overall, the next action in Bitcoin depends on whether the price can break through above $73,200 or test support near $69,500. It is an indication that the market remains stable but needs more conviction to define a trend.
This article contains market analysis and price predictions. These are not guarantees. Crypto markets are volatile. Always DYOR. Not financial advice.
Also Read | ONDO Faces $0.24 Support Test Amid Weak Momentum and Falling Volume

