Bitcoin continues to exhibit choppy price action, fluctuating within the $60K–$70K range as the market remains in a clear state of indecision. With neither side establishing dominance, further consolidation appears to be the most probable scenario for the week ahead.
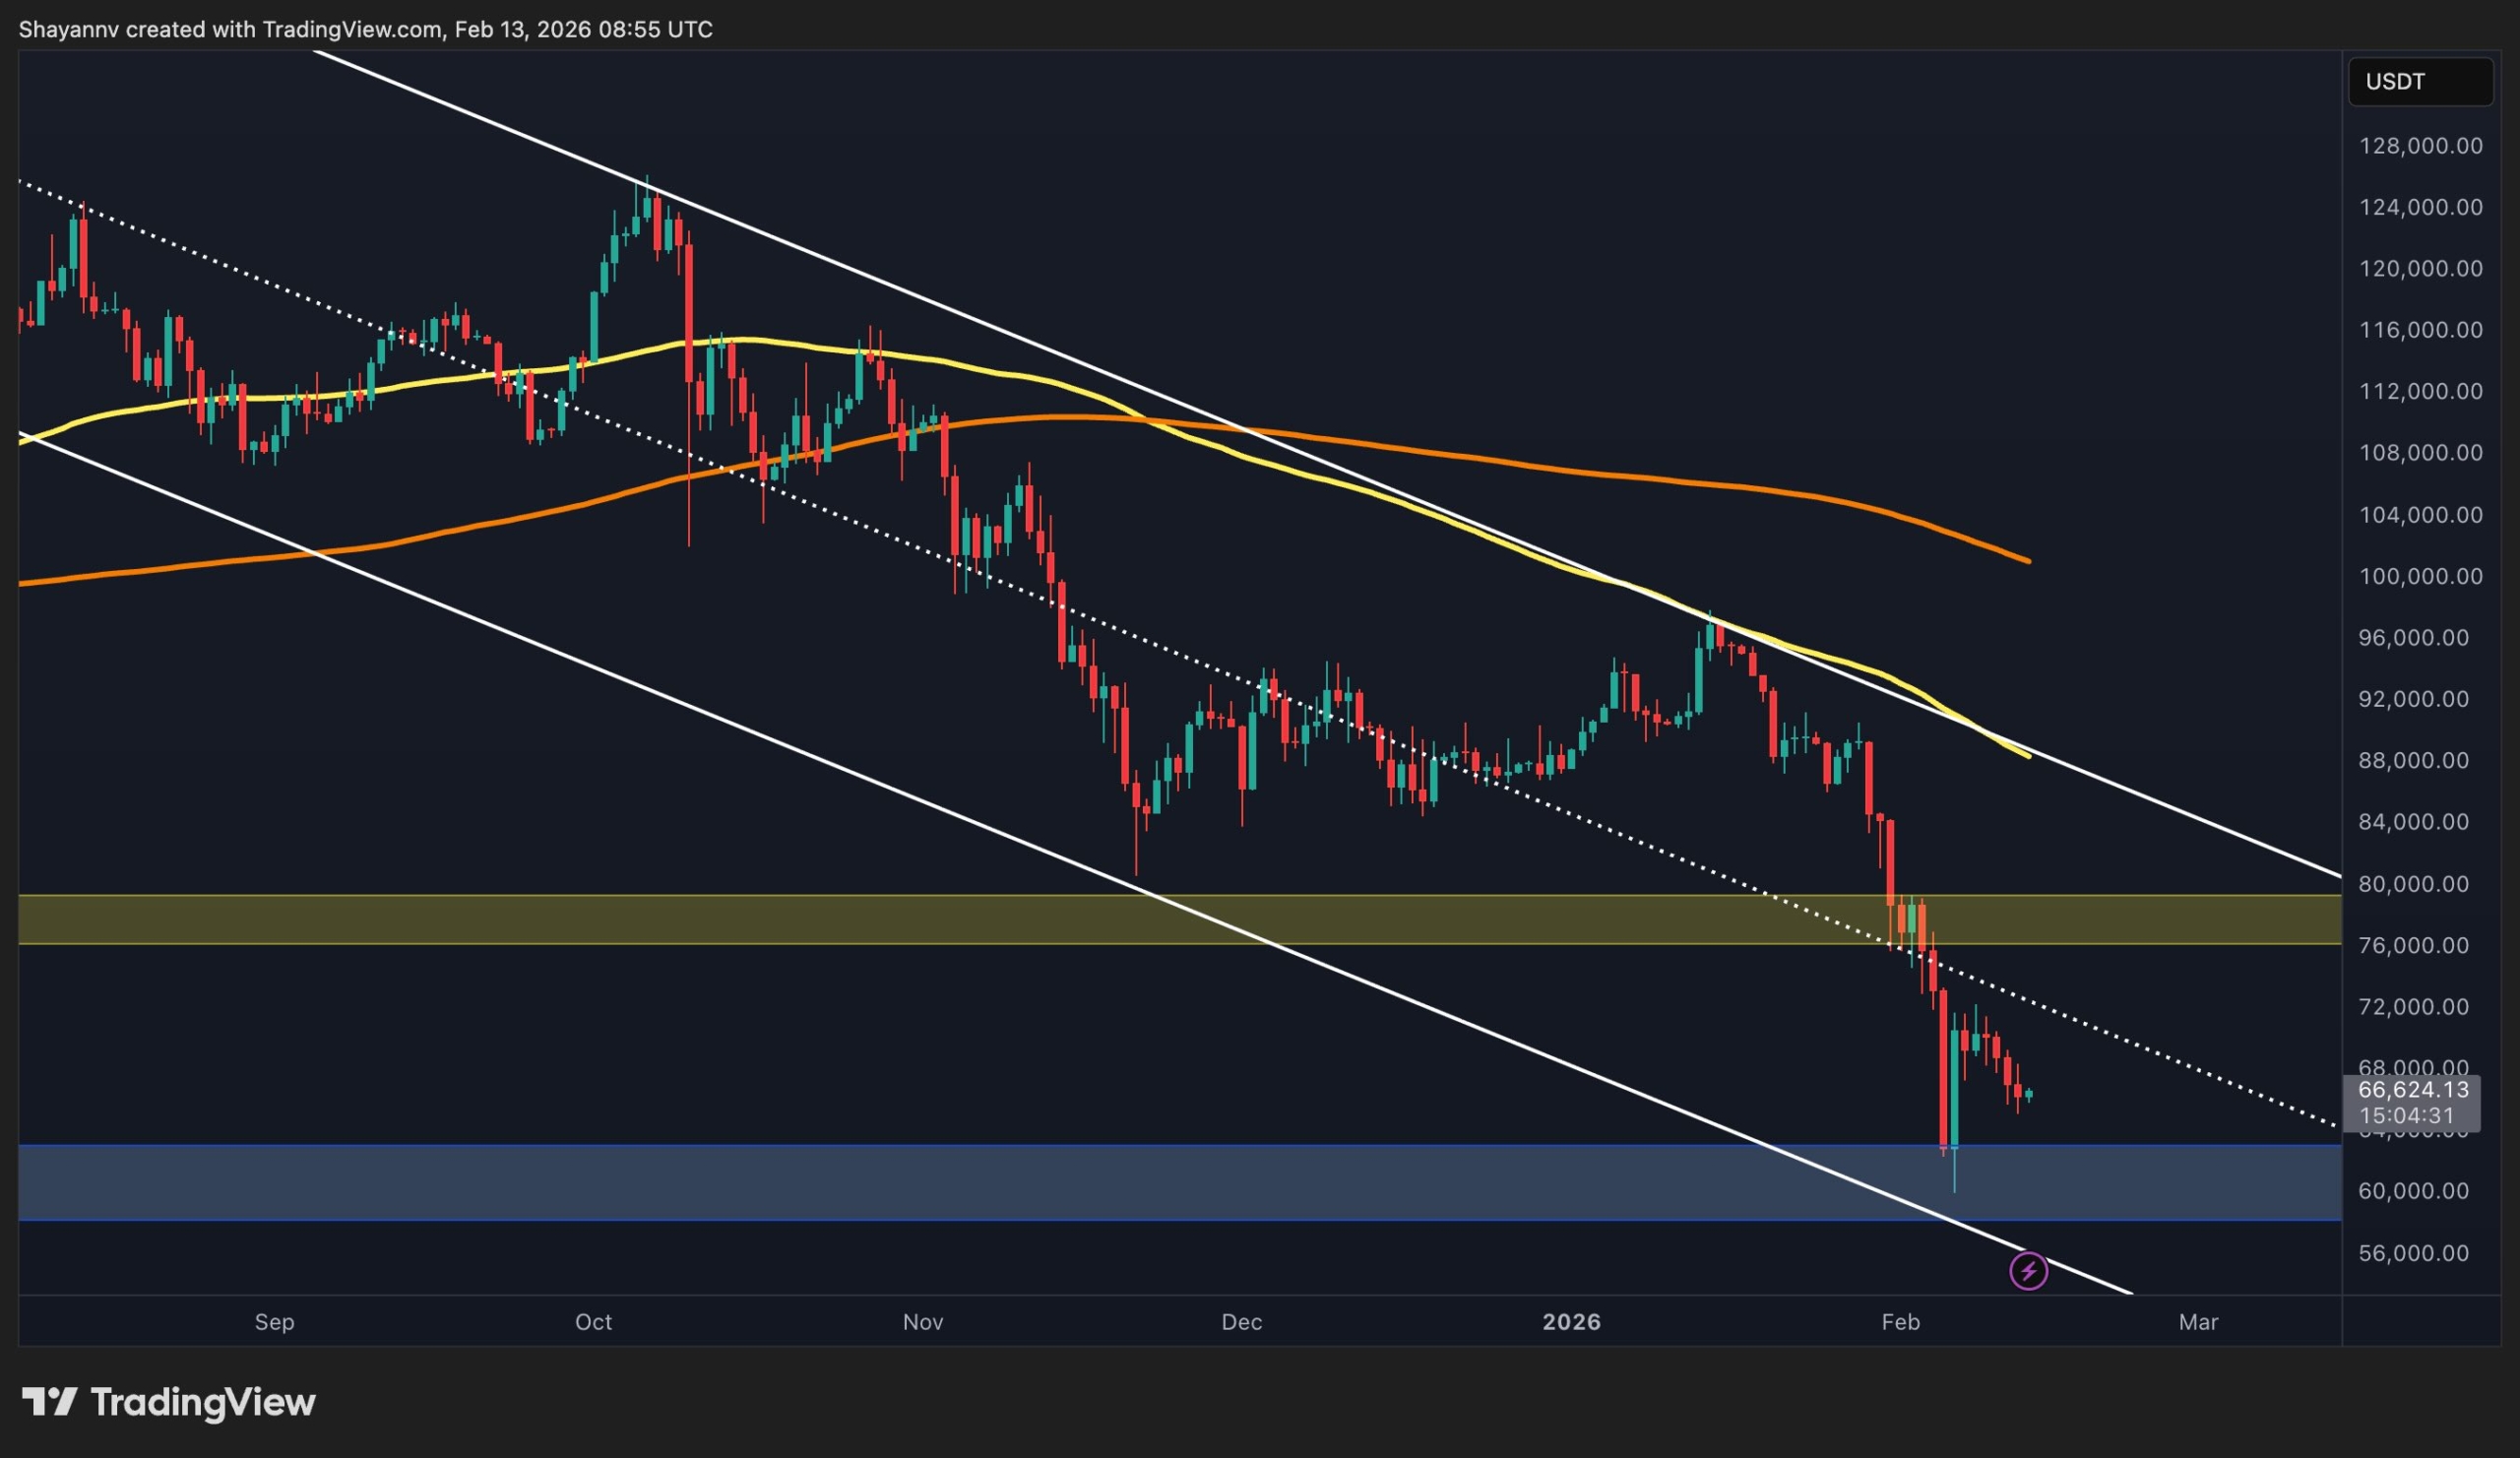
On the daily timeframe, BTC’s rejection at the $70K level resulted in a gradual pullback toward the key $65K support area. The $70K region coincides with the midline of a multi-month descending channel, reinforcing its importance as both a structural and psychological supply zone.
A decisive reclaim of $70K, accompanied by a breakout above the channel’s midpoint, would be required to shift momentum and initiate a more sustainable bullish leg. Otherwise, Bitcoin is likely to remain confined within the $60K–$70K range until fresh demand or supply triggers a directional expansion.
On the 4-hour timeframe, declining volume and overlapping candles reflect the market’s equilibrium state. The recent low-momentum drift lower suggests that neither buyers nor sellers are in firm control.
Price may continue to ease toward the $63K internal support level, where short-term stabilization could occur. More broadly, the $60K region remains the primary defense zone for buyers. Sustained accumulation around this level could eventually lay the groundwork for a renewed bullish attempt.

The 2-week liquidation heatmap on Binance shows Bitcoin trading between two major liquidity clusters that are likely to shape the next impulsive move. To the upside, a dense concentration of short liquidation liquidity is positioned between $78K and $82K, with additional buildup toward $85K.
A breakout above the intermediate $72K resistance could accelerate price toward this zone, potentially triggering a short squeeze if $80K is reclaimed. On the downside, liquidity remains relatively thin until the $60K–$62K region, which aligns with the recent swing low.
A decisive break below $60K could expose this pocket and lead to a deeper liquidation-driven move toward the mid-$50K area. For now, Bitcoin remains compressed between $72K resistance and $60K support. A breakout on either side is likely to trigger a volatility expansion, while continued range-bound movement would reinforce the current consolidation phase.

The post Bitcoin Price Analysis: Liquidation Heatmap Reveals BTC’s Most Crucial Levels appeared first on CryptoPotato.


