Bitcoin ETF outflows hit $90.66M as BTC retests $64,400 resistance after holding $63,500 support, with assets at $78.32B.
Bitcoin is trading near a key short-term area after holding support around $63,500 several times. The repeated defense of this level has kept buyers active despite weaker ETF demand.
BTC has now moved back toward the $64,400 resistance zone. The last attempt at this area failed, so traders are watching the next reaction closely.
At the same time, Bitcoin ETF flows remain under pressure. The latest chart shows daily net outflows of $90.66 million, while total net assets stand near $78.32 billion.
This creates a mixed setup for the market. Bitcoin is trying to break higher, but ETF outflows still show weaker demand from fund investors.
Bitcoin has found support near $63,500 several times over the past few days. That level has helped price avoid a deeper short-term breakdown, even as ETF flows remain negative.
After defending that zone, BTC moved back toward resistance around $64,400. This area has become important because the previous attempt failed and produced a clear rejection.
Bitcoin is back at a level that matters.
After finding support at $63,500 multiple times over the past few days, BTC has rallied straight back into resistance around $64,400.
The rejection was clear last time.
The question now is whether buyers have enough momentum to break… pic.twitter.com/JqbiVZj63w
— That Martini Guy ₿ (@MartiniGuyYT) June 22, 2026
A clean break above $64,400 could put recent highs back into focus. However, failure to clear that level may keep Bitcoin inside the same trading range.
For now, traders are watching price reactions near resistance. Strong buying volume would support a breakout attempt, while weak demand could invite another pullback.
The ETF flow chart shows a clear shift in demand since late May. Daily total net inflow stands at negative $90.66 million, while total net assets sit near $78.32 billion.
Bitcoin price on the chart is shown near $62,950, after weakening from earlier highs. The trend line has also moved lower as red outflow bars became more frequent.
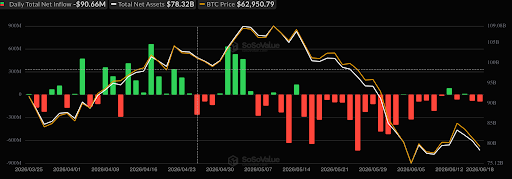
The strongest inflow phase appeared in April and early May. During that period, several green bars moved above $300 million and reached as high as $600 million.
That earlier inflow phase supported stronger price action and higher ETF assets. However, the market structure changed after mid-May as withdrawals increased across several sessions.
Read Also:
Michael Saylor Stays Bullish as Bitcoin Capitulation Remains Elusive
Bitcoin now faces a split setup between technical resistance and weaker ETF demand. Price has bounced from support, but fund flows have not yet returned to steady inflows.
Some recent outflow sessions reached near $600 million to $700 million. Those larger red bars matched the period when Bitcoin price started falling more sharply.
The latest outflow is smaller than those larger withdrawal sessions. Still, it shows that selling pressure has not fully cleared from the ETF market.
For BTC to regain stronger momentum, ETF flows may need to return to consistent green readings.
Until then, traders may continue watching the $63,500 support and $64,400 resistance range.
The post Sixth Week of ETF Outflows Hits BTC While Price Tests Resistance appeared first on Live Bitcoin News.

