
Bitcoin has been moving in a sideways, volatile range over the past few days, causing forced liquidations across both Long and Short positions.
Data provided by Alphractal on March 12 indicates that the market is presently dominated by long positions. The risk of liquidation is the lowest at $61,000.
Positions that are short are mostly concentrated around the price of $75,000. The Liquidation Levels tool provided by the platform is accurate and monitors various exchanges.
Alphractal is planning to add this tool to a lot of different Altcoins. The tool will allow users to observe important liquidation points and set up alerts.

Source: X
The dominance of longs indicates that people are cautiously optimistic about the market; however, volatility is still extremely high.
The concentration of positions at $61K indicates that people think this is an important level for support, while Shorts at $75K could indicate a potential resistance area.
Also Read: Bitcoin Holds Firm Between $62K–$72K As Buyers Return
On March 11, CryptoQuant noted that Bitcoin’s short-term liquidity indicated it may be relatively undervalued. The 1-week to 1-month holding ratio has declined significantly.
This is a common pattern at past bear market bottoms. While this does not guarantee a bottom, it does indicate an area where the risk/reward may be favorable to buying more.

Source: X
It is also a bad idea for investors to try to identify where the exact bottom is in the market. Instead, diversify investments among different levels where both value and potential opportunities meet.
This will enable you to benefit from potential opportunities while limiting risk, particularly in a volatile market sentiment, which is currently the case.
An evaluation of the world’s liquidity strength, particularly in M2 money supply, provides an even wider perspective on the crypto cycle.
According to CryptoCon, after the peak in world M2 strength in November 2025, momentum driven by liquidity has started to decrease. This has often correlated with significant market tops and subsequent corrections.
There are three stages in the crypto cycle, as depicted in the chart: an initial recovery with increased liquidity, an expansion in the middle, and a final, sharp increase in the latter stages.
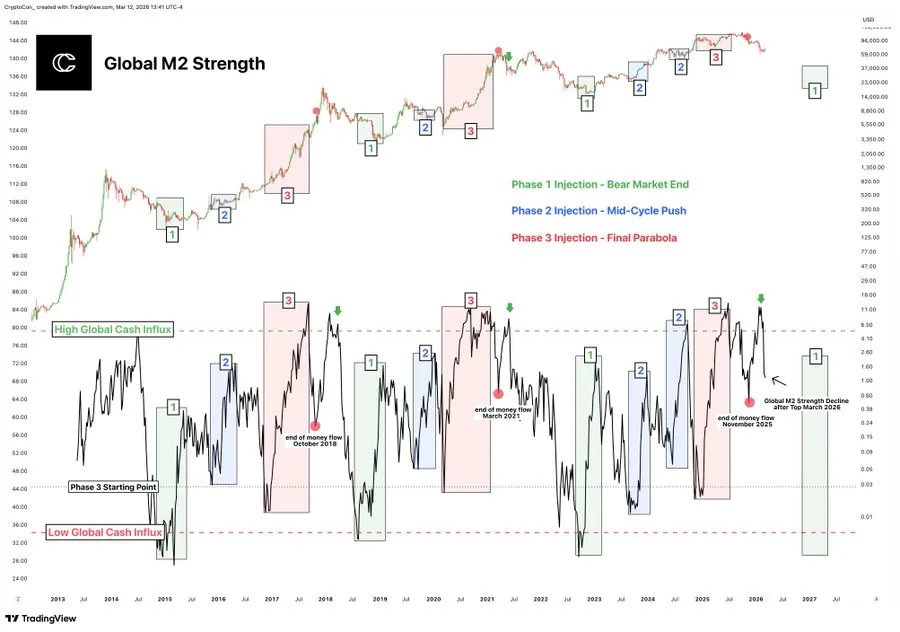
Source: X
The decrease in M2 strength indicates that the most active liquidity stage from the last cycle may be complete. As the flow of money into the market slows down, prices decrease, and consolidation occurs.
However, it is believed that global liquidity will increase again in 2026-2027, which could signal a new accumulation period.
Therefore, trading opportunities are available in the short term; however, it is necessary to be patient if we want to see a major move upward in the market.
This article contains market analysis and price predictions. These are not guarantees. Crypto markets are volatile. Always DYOR. Not financial advice.
Also Read: Bitcoin Bearish Call Intensifies as Bloomberg Strategist Repeats $10,000 Forecast

