Bitcoin has broken out of a six-week range with the most violent daily candle since early June. BTC opened at $64,686, ran to an intraday high of $69,749, and sits at $68,761, up 6.20% on the day.
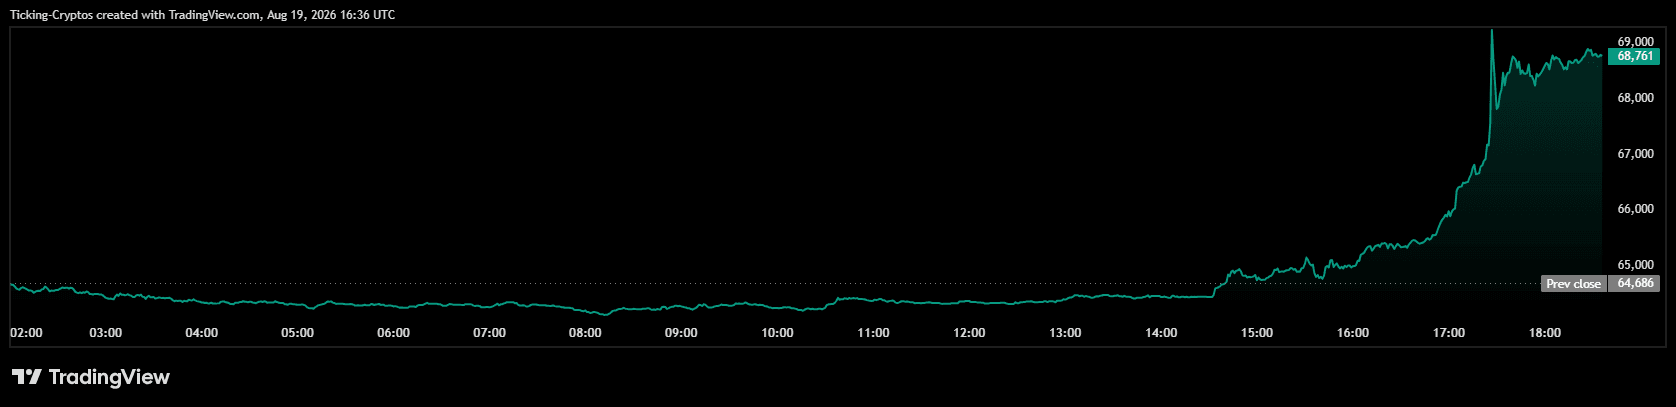
The trigger came from the bond market, not from crypto. The US Treasury announced it will at least double the size of its long-dated buyback operations, from $2 billion to at least $4 billion per operation, starting 9 September. Long-end yields dropped immediately, the dollar weakened, and analysts nicknamed the move "QE Lite."
That mattered because $Bitcoin had spent the entire year losing a competition against a 30-year Treasury paying over 5% risk-free. Make the safe option less rewarding and capital rotates back into risk. The move was then amplified by roughly $10 billion of short liquidation liquidity sitting above the price, which turned a rally into a forced-buying cascade.
The range that trapped Bitcoin since June is gone.
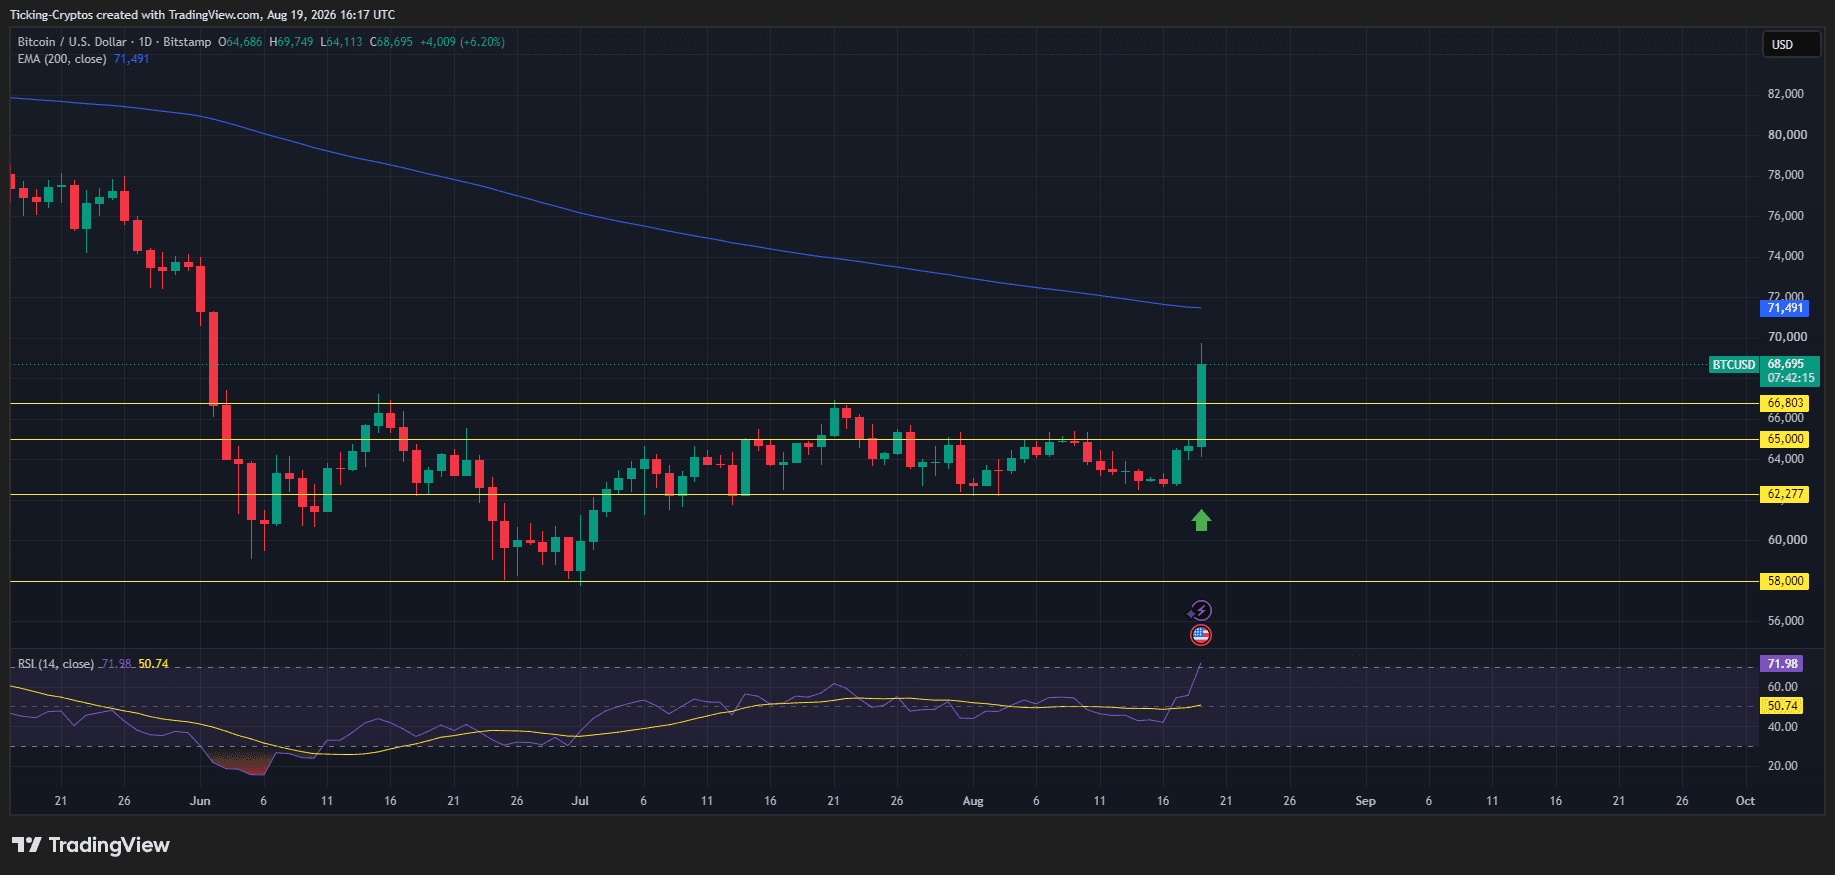
All three are now below the price. The daily candle opened at $64,686 and ran 7.83% to its high, clearing every one of them in a single session.
This is the part worth paying attention to.
The range measured $66,803 at the top and $62,277 at the floor, a height of $4,526. The standard measured-move projection adds that height to the breakout point:
$66,803 + $4,526 = $71,329
Now look at where the 200-day EMA sits: $71,491.
Two completely unrelated methods, one geometric and one based on a moving average, land within $162 of each other. That confluence zone around $71,300 to $71,500 is the next target, roughly 4% above the current price.
The 200-day EMA is not just another line. It is the level that separates a relief rally inside a downtrend from an actual trend change. Bitcoin has not closed a daily candle above it since this decline began, and it is still sloping downward.
There is a second obstacle sitting just under it. Short-term holders, meaning wallets holding coins for less than 155 days, have an average cost basis near $68,700. Bitcoin is trading almost exactly at that number right now, which means every buyer from the decline just got back to breakeven. Breakeven is historically where a lot of people sell to get out.
So Bitcoin faces two walls in quick succession: a supply overhang at current price, then the EMA at $71,491.
Days like this are exactly when having a broker account already open matters. XTB gives you crypto, stocks, ETFs, indices and commodities from a single regulated European account, with no inactivity fee and no minimum deposit.

CFDs are complex instruments and come with a high risk of losing money rapidly due to leverage.
The daily RSI jumped to 71.98 from a moving average sitting at 50.74. That gap is enormous. It tells you the move was near-vertical rather than a gradual build, and it puts the daily RSI into overbought territory for the first time in months.
Vertical moves into overbought conditions resolve two ways: a sharp continuation that squeezes the remaining shorts, or an equally sharp snapback that fills the candle. The indicator will not tell you which comes first.
Upside
Downside





