Bitcoin is consolidating just around the $114K level after weeks of volatility, with price action showing mixed signals across timeframes. The daily chart suggests momentum is fading, while the 4-hour chart highlights a tightening structure near resistance. Meanwhile, on-chain data continues to point to structural accumulation.
By Shayan
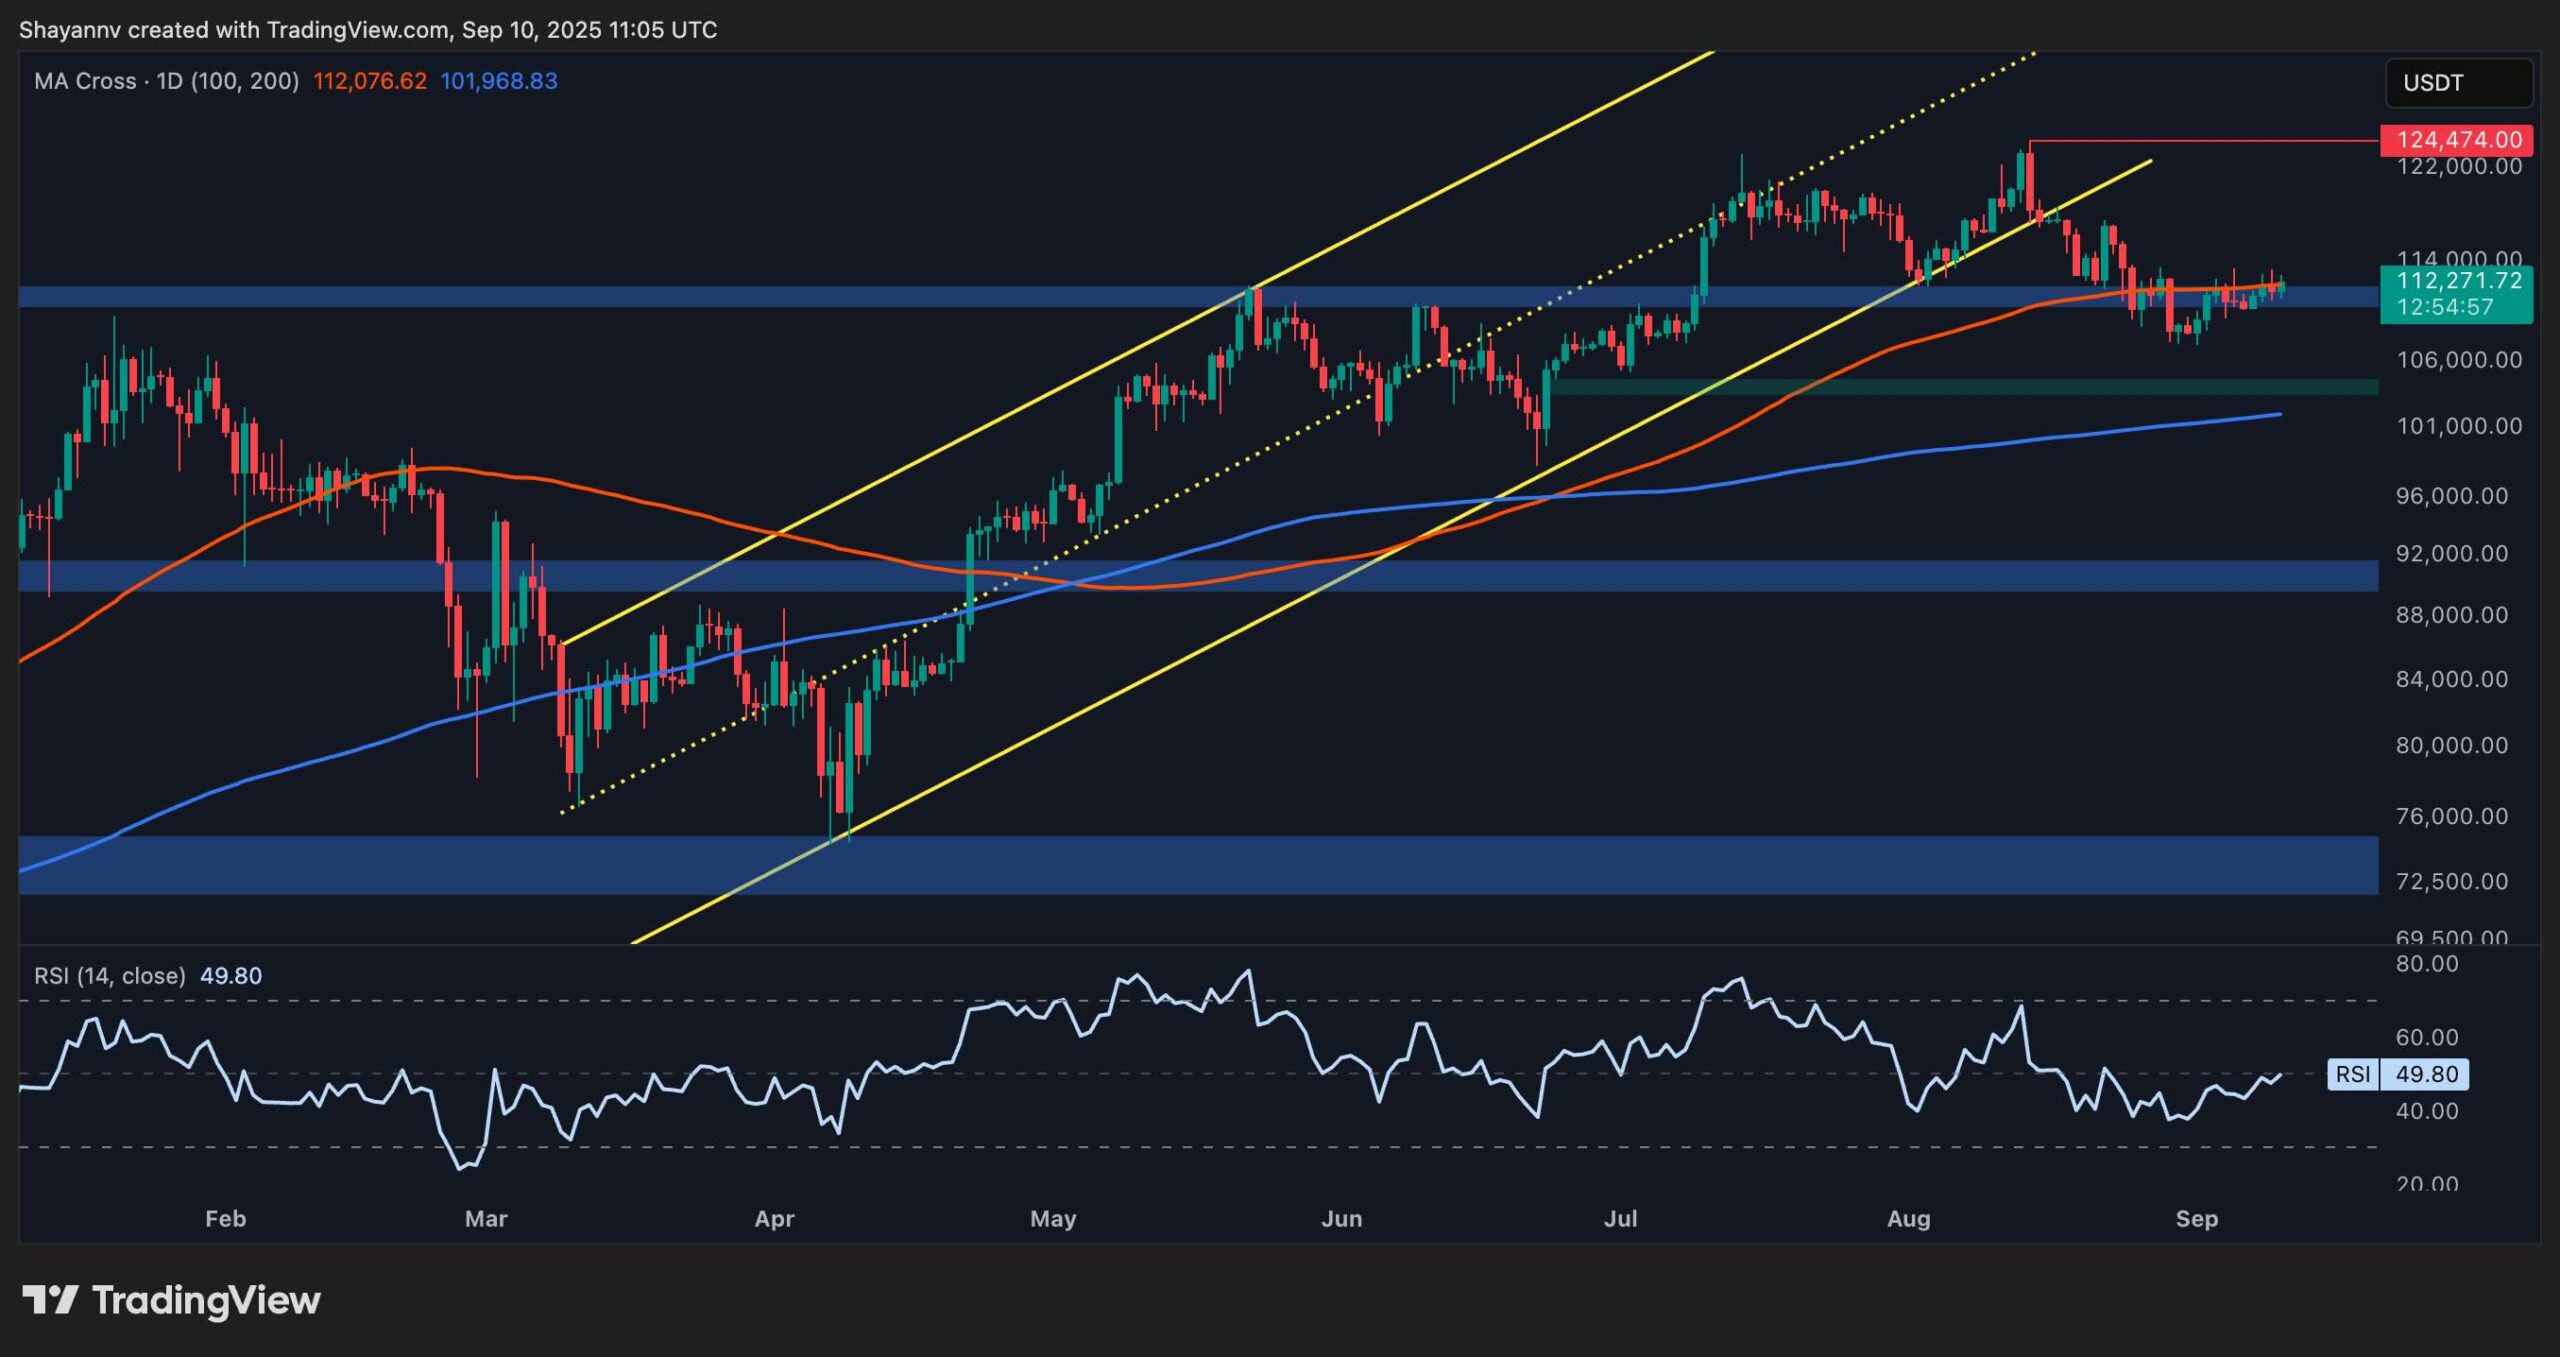
On the daily chart, Bitcoin has broken out of its rising channel but is now struggling to reclaim higher levels. The asset is hovering around $114K, just below the 100-day moving average, which is acting as resistance. The RSI sits around 50, reflecting a neutral momentum state, neither oversold nor overbought.
If bulls can close above the moving average, the next target will be the $124K all-time high zone. However, repeated failures here could drag the market lower, with the $104K fair value gap serving as the key demand area supported by the 200-day moving average around $101K. This zone would be the last line of defense before a deeper correction.
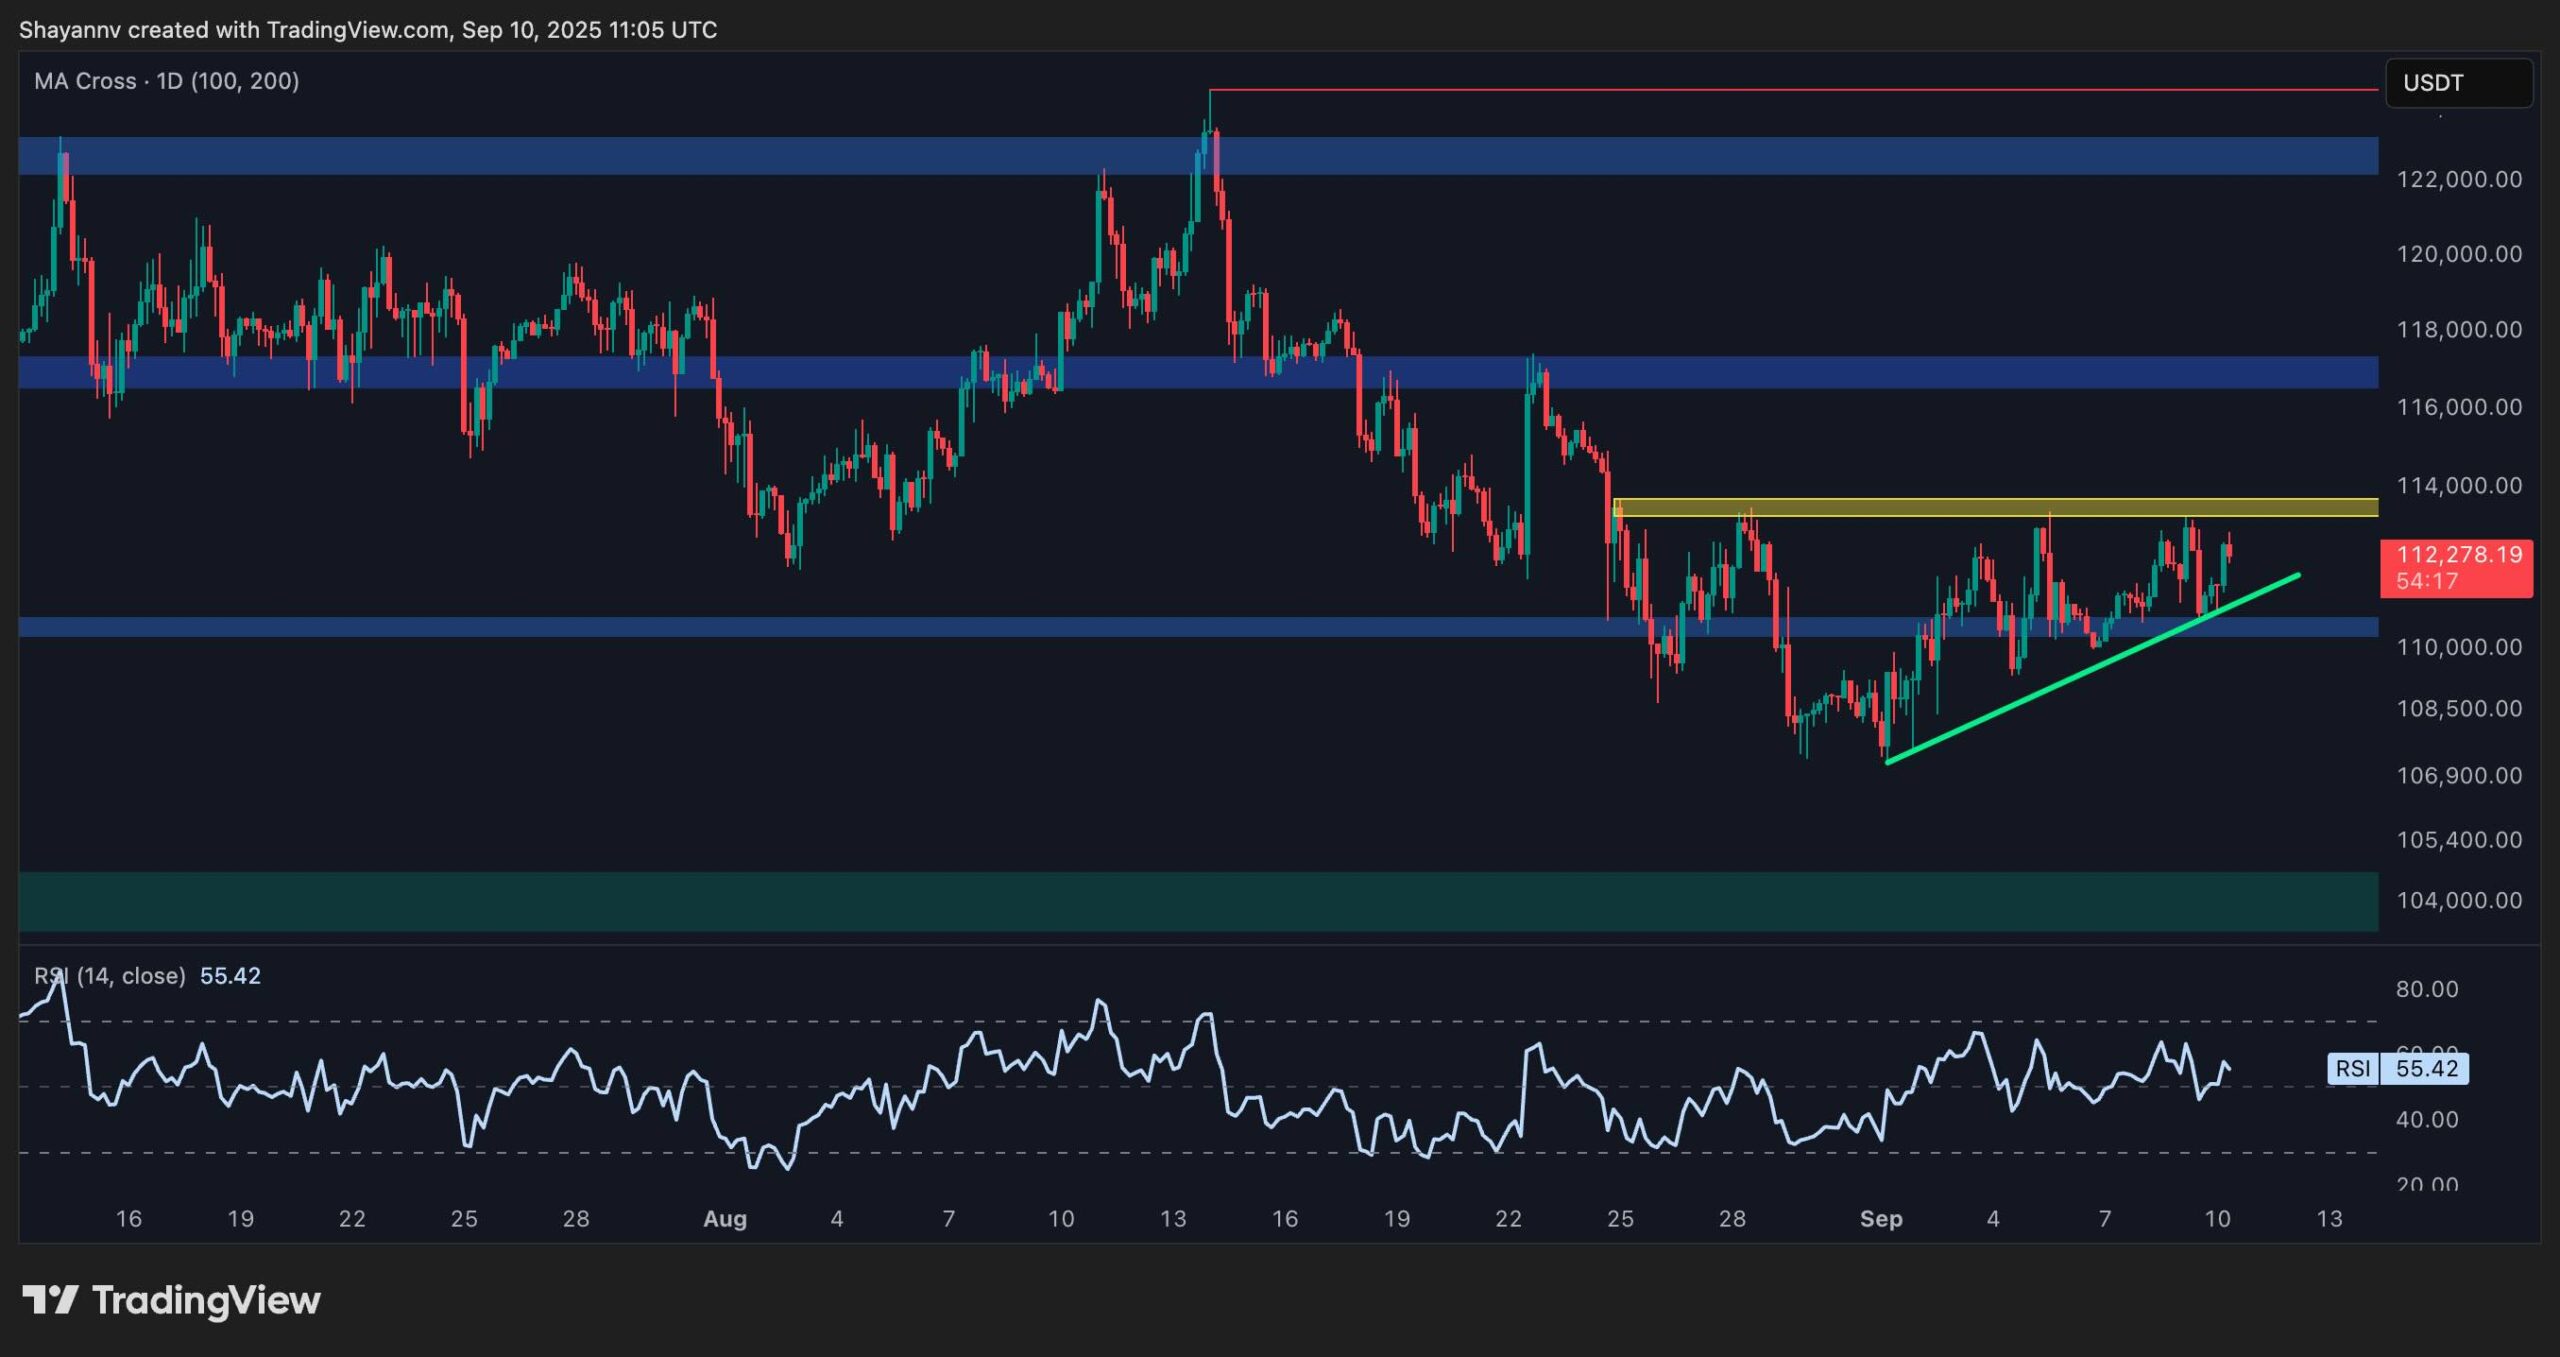
The 4-hour chart shows price consolidating inside a tightening ascending triangle, with higher lows forming around $110K and the key resistance capped at $114K. The RSI at 55 also suggests momentum is slightly in favor of buyers, but the breakout is not yet confirmed.
If buyers manage to push above $114K with volume, a rally toward $118K–$120K could unfold quickly. On the downside, losing the ascending trendline and or the $110K support zone would weaken the bullish structure and open the way back to $104K. For now, the short-term bias depends on how the price reacts at the $114K ceiling.
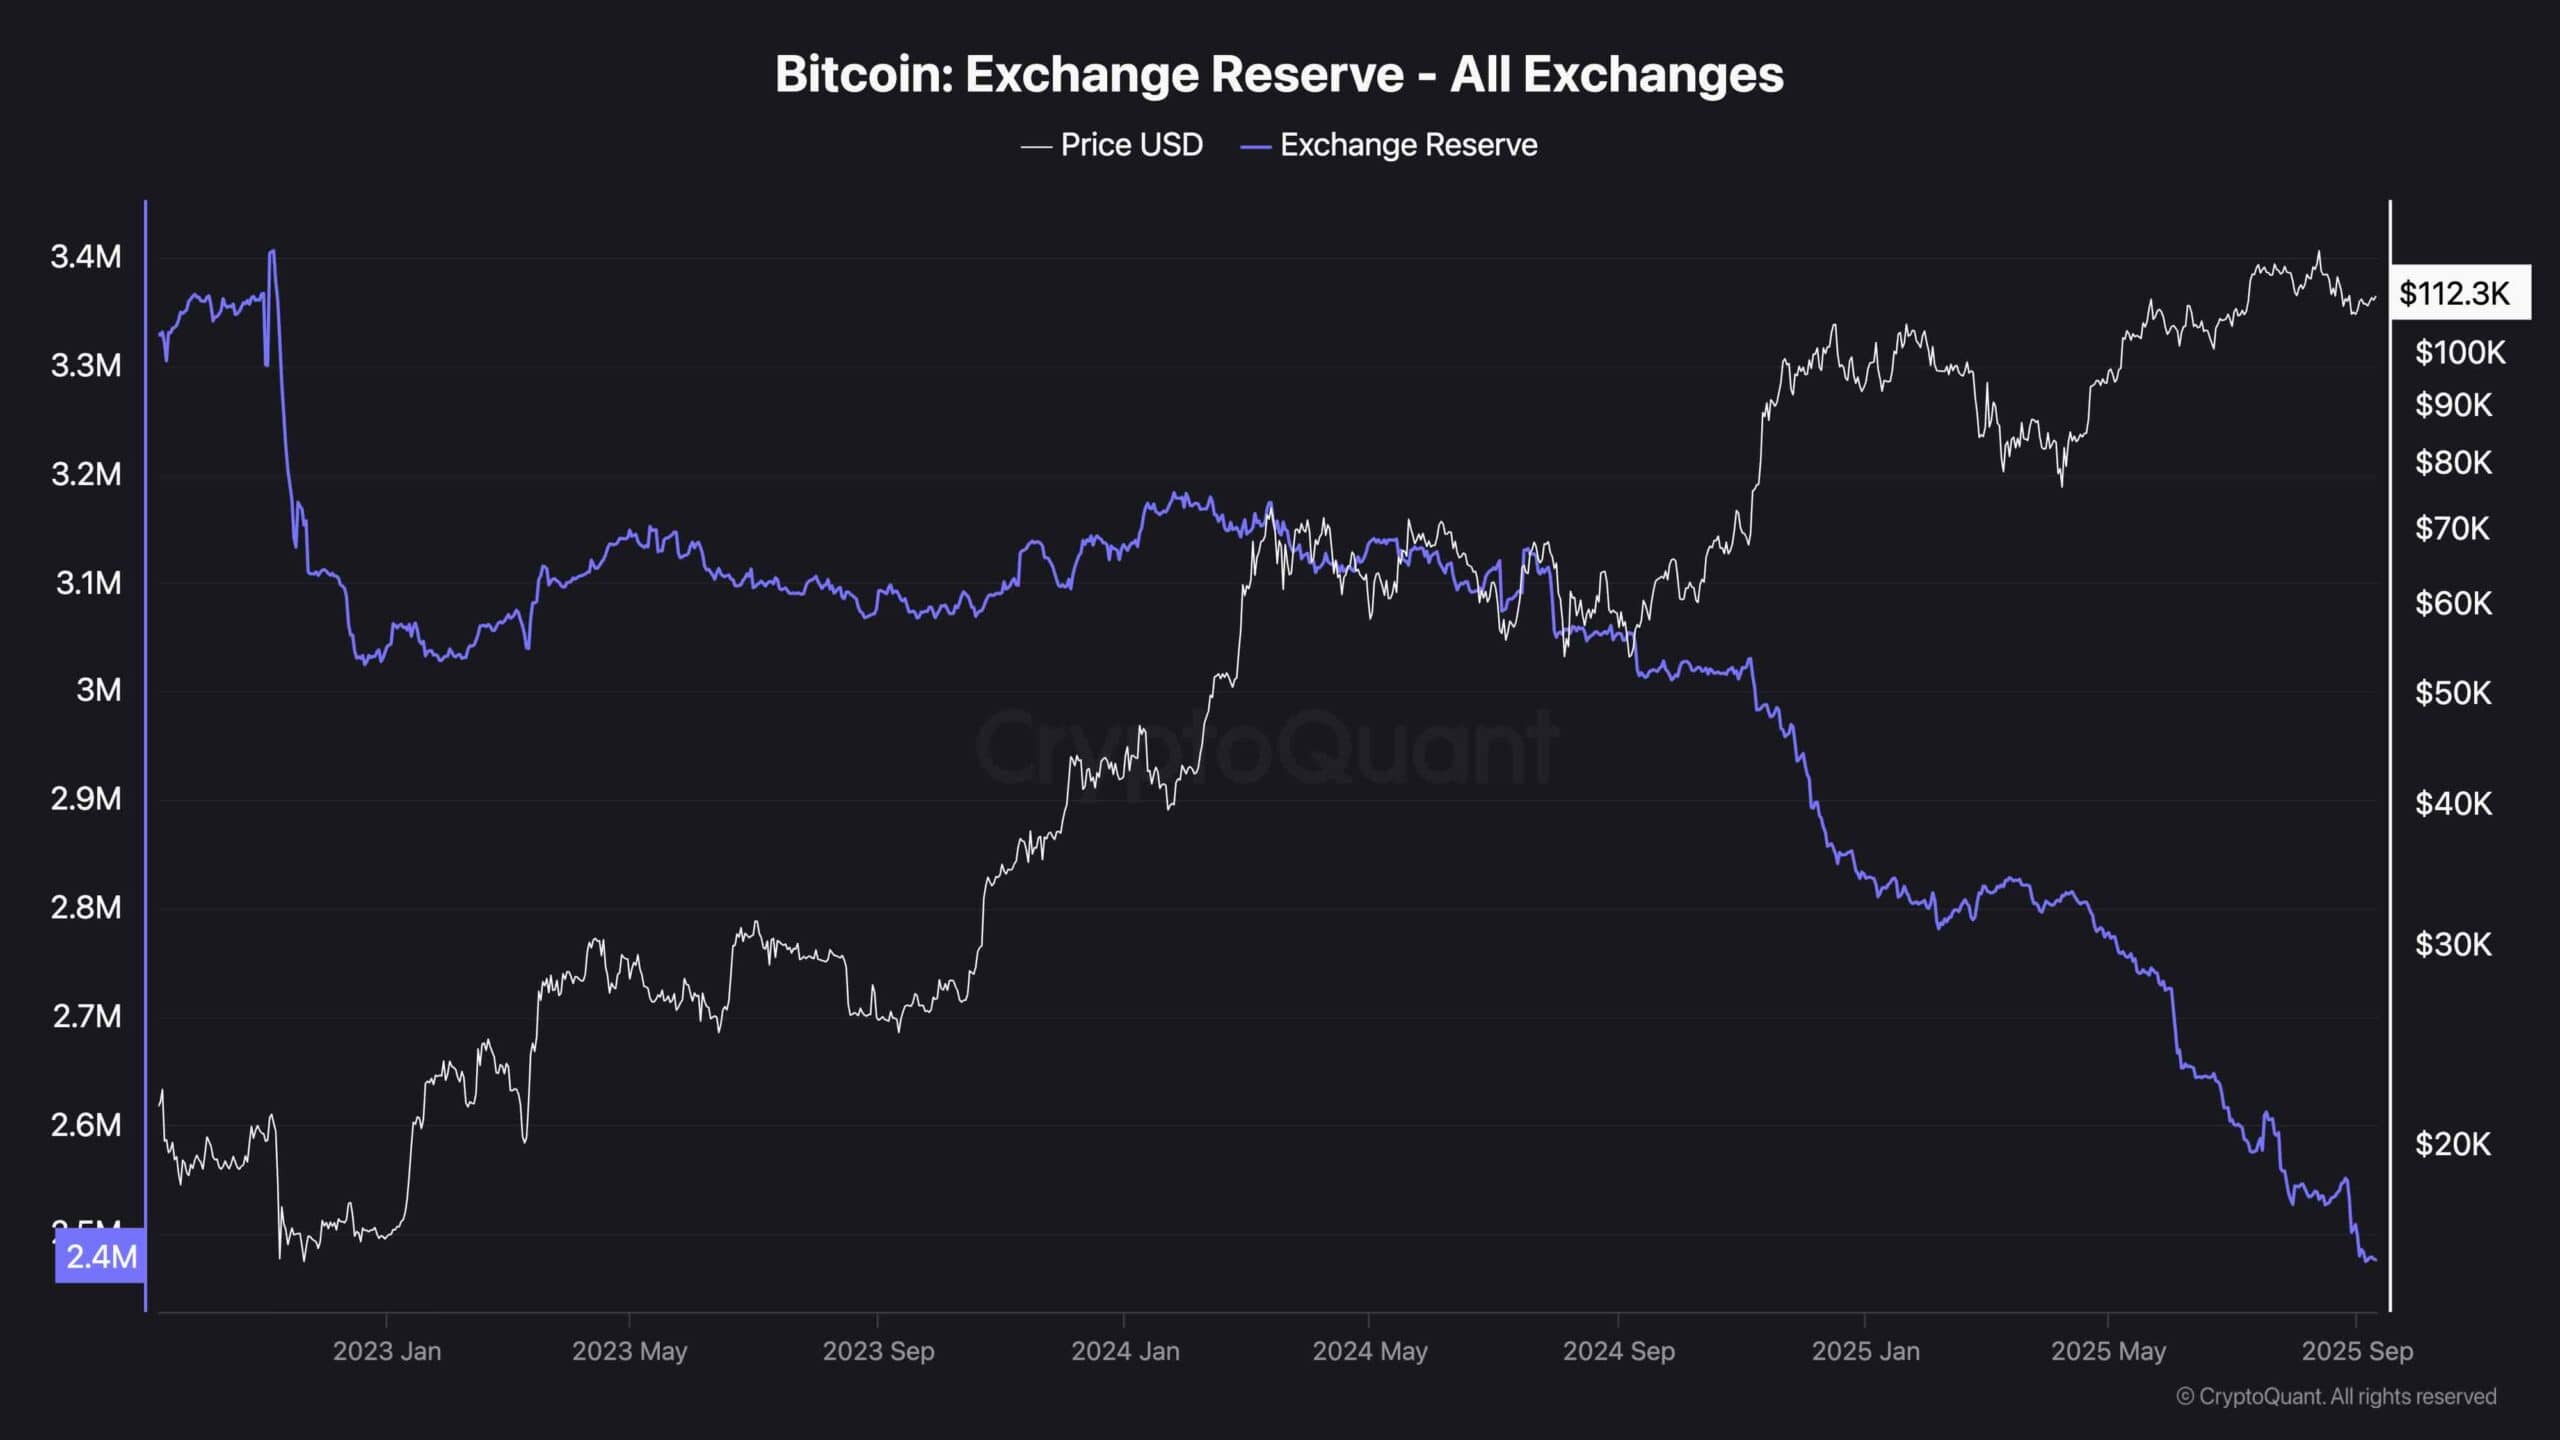
Exchange reserves continue to decline sharply, falling to multi-year lows. This persistent outflow, which is quite odd for BTC being at all-time highs, indicates that investors are moving coins into long-term storage, reducing the liquid supply available for trading. Such a supply contraction often supports price stability and sets the stage for bullish moves when demand increases.
However, in the short term, declining reserves also mean thinner liquidity on exchanges. This can amplify volatility around key levels, making breakouts and breakdowns sharper. Overall, the reserve trend reinforces the long-term bullish case but doesn’t eliminate the near-term risk of corrections if buyers fail to reclaim resistance.
The post Bitcoin Price Analysis: BTC Battles Key Resistance on Path to New ATH appeared first on CryptoPotato.

