Bitcoin Price Prediction: BTC Stabilizes at $91K, Is a Bigger Move Coming Next?

30-Nov-2025 CryptoTicker.io News

$Bitcoin is trading around $91,200 after a sharp rebound from its lower support area. Bitcoin recovered steadily after a multi-day selloff, now consolidating sideways as volatility compresses. With the market approaching December catalysts, traders are watching whether BTC will reclaim key resistance levels or risk a deeper correction.

Here’s the full analysis based on the chart.

Bitcoin Chart Analysis: What Just Happened

1. Strong Rebound From $80,000 Support

The chart shows a clear bounce from the $80,000 macro support zone, marked by the lowest yellow line. Price tapped this level only once, triggering a fast reversal and forming a clean V-shaped recovery.

BTCUSD_2025-11-30_12-41-44.png

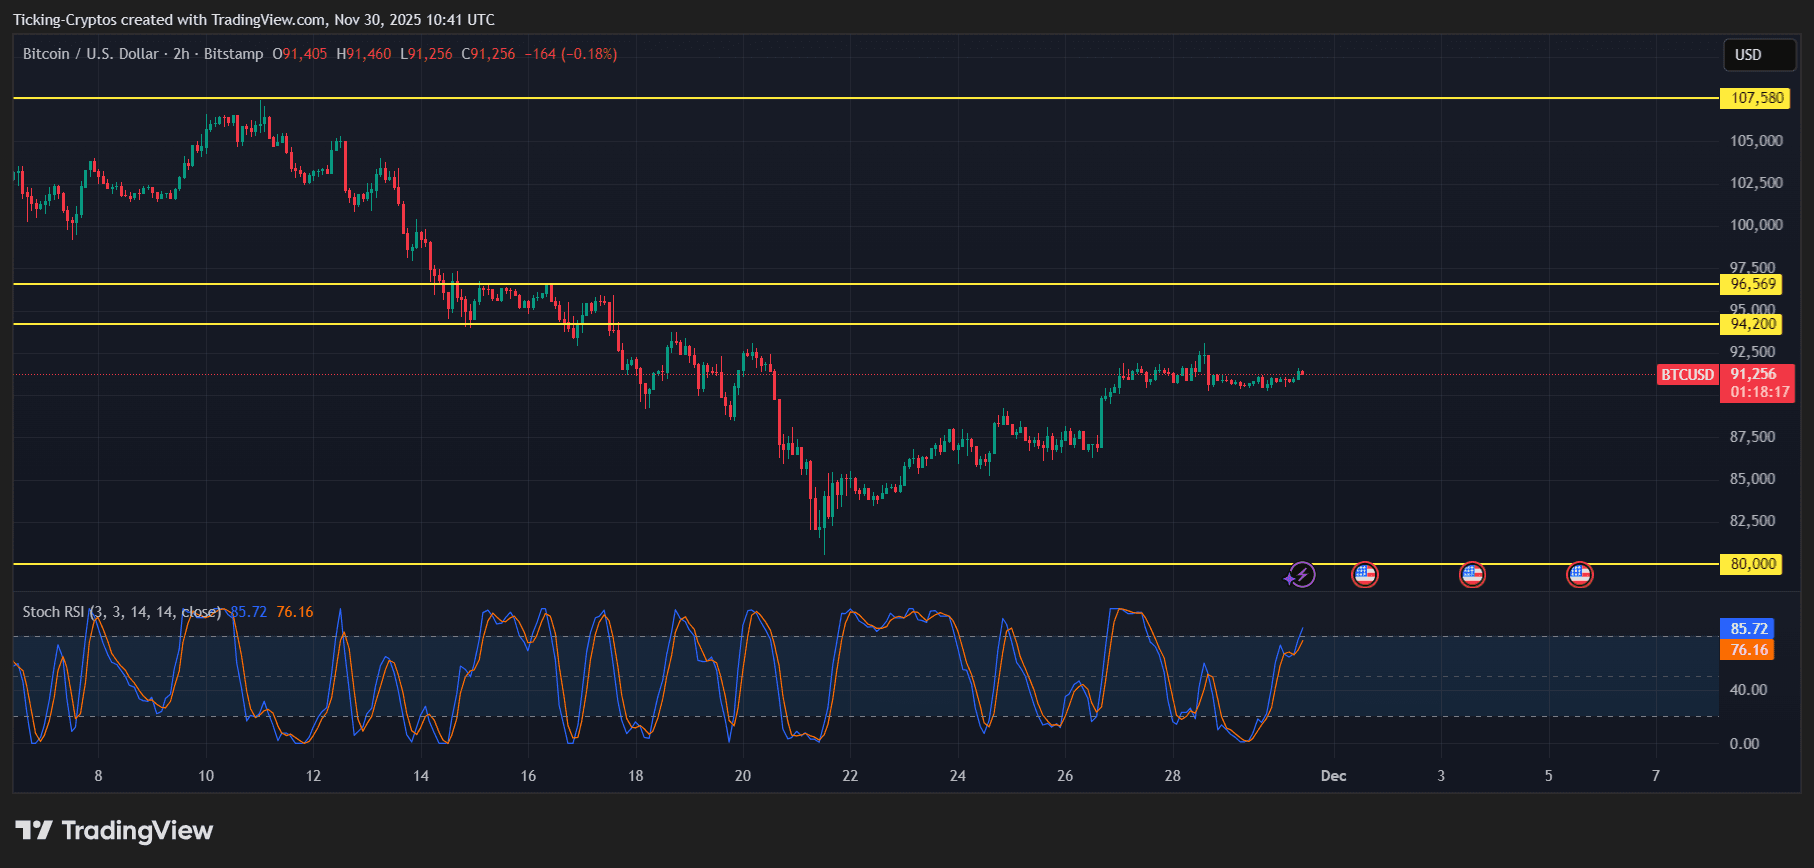
BTC/USD 2-hours chart - TradingView

This confirms:

  • Buyers are defending $80K aggressively
  • Liquidations at the lows triggered a strong short-squeeze
  • Market structure remains bullish as long as $80K holds

2. Current Consolidation Around $91K

BTC is now moving sideways between $90,000 and $92,000, forming a tight consolidation range.

This usually signals:

  • A cooling period after a strong bounce
  • Reduced volatility before the next move
  • Traders waiting for direction (RSI and Stoch RSI validate this)

3. Momentum Oscillators Flashing Overbought

The Stochastic RSI (3,3,14,14) is sitting at:

  • 85.72 (blue line)
  • 76.16 (orange line)

This indicates overbought conditions, meaning the current short-term uptrend may slow before trying to break higher levels.

However — overbought readings are normal in strong bull cycles. They don’t necessarily imply a crash; they usually show BTC is preparing for another volatility spike.

Bitcoin Analysis: Key Levels to Watch

Immediate Support

  • $90,000 – Minor support in the current range
  • $80,000 – Major macro support (must hold)

Immediate Resistance

  • $94,200 – First strong barrier
  • $95,000 – $96,569 – Heavy resistance cluster
  • $97,500 – Last wall before a major breakout

Macro Resistance

  • $107,580 – The long-term target from the chart's upper band

Bitcoin Price Prediction: What Comes Next

Based on market structure, indicator behavior, and price levels, here are the most likely scenarios:

Bullish Scenario (Most Probable If $90K Holds)

$BTC attempts another leg up toward the next resistance zone.

Upside Targets

  • $94,200
  • $95,000 – $96,569
  • $97,500
  • $107,580 (major breakout target)

If Bitcoin closes a 4h or daily candle above $97,500, it would open the door to fresh all-time highs and a run toward ~$110K.

Bearish Scenario (If BTC loses $90K)

A rejection from resistance combined with weakening momentum could send BTC back to retest lower supports.

Downside Targets

  • $88,000 (minor liquidity zone)
  • $85,000
  • $80,000 (critical support)

If $80K breaks — unlikely for now — BTC could enter a mid-term correction.

Also read: November Was Bitcoin’s Second Worst Month In 2025
About Author Lorem ipsum dolor sit amet, consectetur adipiscing elit. Nunc fermentum lectus eget interdum varius. Curabitur ut nibh vel velit cursus molestie. Cras sed sagittis erat. Nullam id ante hendrerit, lobortis justo ac, fermentum neque. Mauris egestas maximus tortor. Nunc non neque a quam sollicitudin facilisis. Maecenas posuere turpis arcu, vel tempor ipsum tincidunt ut.
WHAT'S YOUR OPINION?
Related News