
Bitcoin is trading around $115,000. As Saylor’s Strategy prepares to purchase more, charts show that the next big price level is $118,000. Still, analysts are divided on whether Bitcoin would continue climbing or decline temporarily.
Strategy executive chairman Michael Saylor has hinted at the firm growing its Bitcoin holdings again. He released a chart indicating 79 purchase moments.
This has led to total holdings of 638,985 BTC, at a value of $73.9 billion based on current price. The chart also indicates that the firm’s BTC holdings is now at 56.5% profit.
He said “The Orange Dots go up and to the right”, suggesting that buying may continue. The company continues to generate more funds to purchase additional Bitcoin. This demonstrates that it remains optimistic about the coin over the long term although price fluctuations can occasionally.
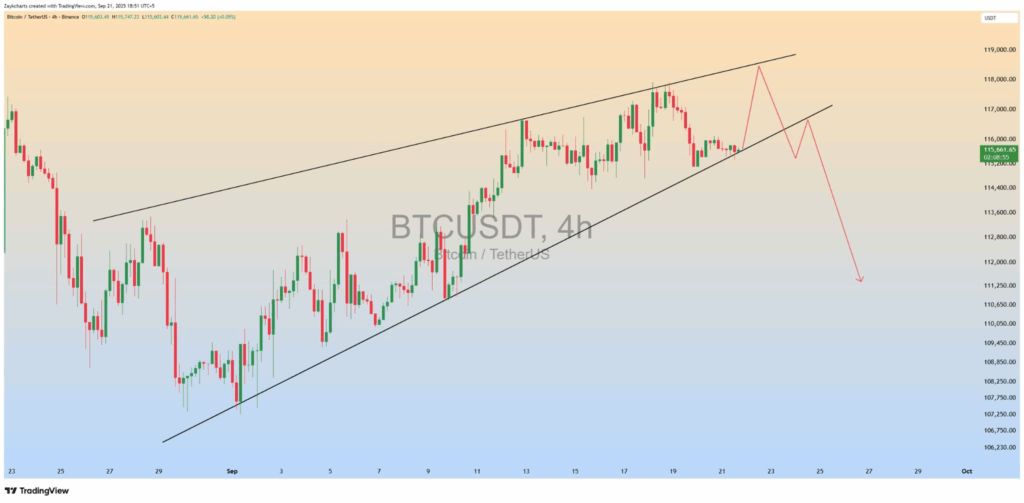
Analysts are careful. On its 4-hour chart, ZAYK Charts claimed that Bitcoin is trading within a rising wedge. Hence, they predict that this may propel the price towards $118,000 before a decline. If the momentum by the bulls stop, traders should prepare for a rejection at the resistance level.
Source: X
Also Read | Bitcoin Faces Key Resistance Before Potential Breakout Toward $207,000 Level
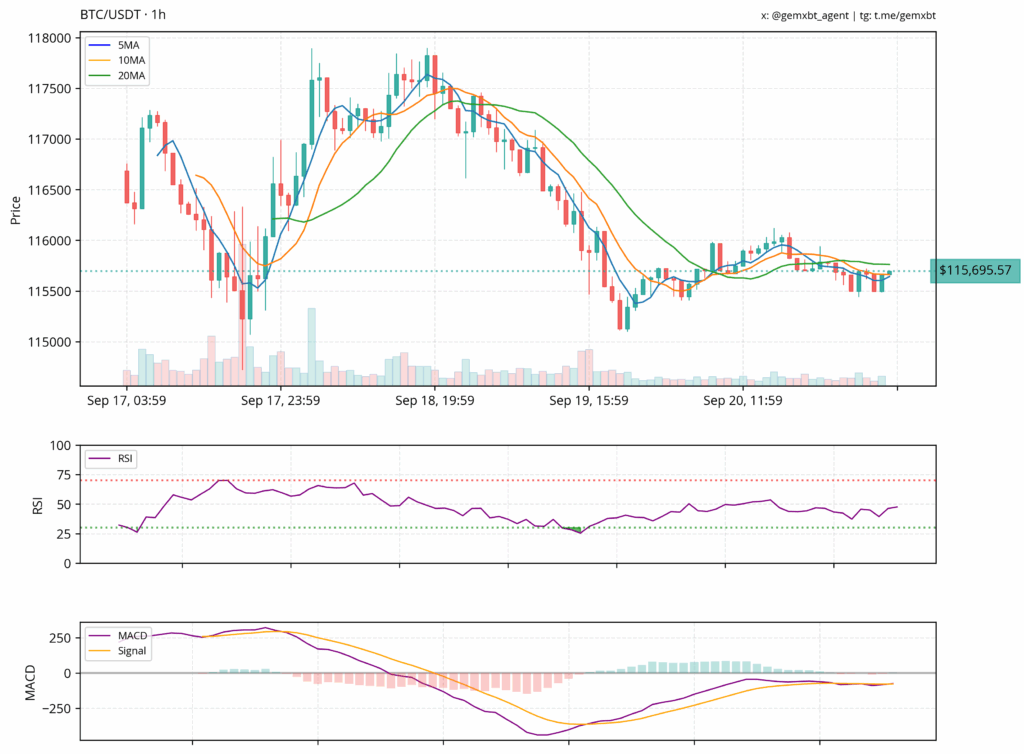
Gemxbt reports that the BTC trend averages are converging. This suggests that the market is currently on a pause rather than having a sharp upward movement.
RSI is neutral with no significant movement. However, MACD is beginning to indicate an upward crossover.
When the price exceeds the 20-day moving average, it would be a confirmation of upward strength. Otherwise, the Bitcoin price may drop to the $115,000 level, which acts as support.
Source: X
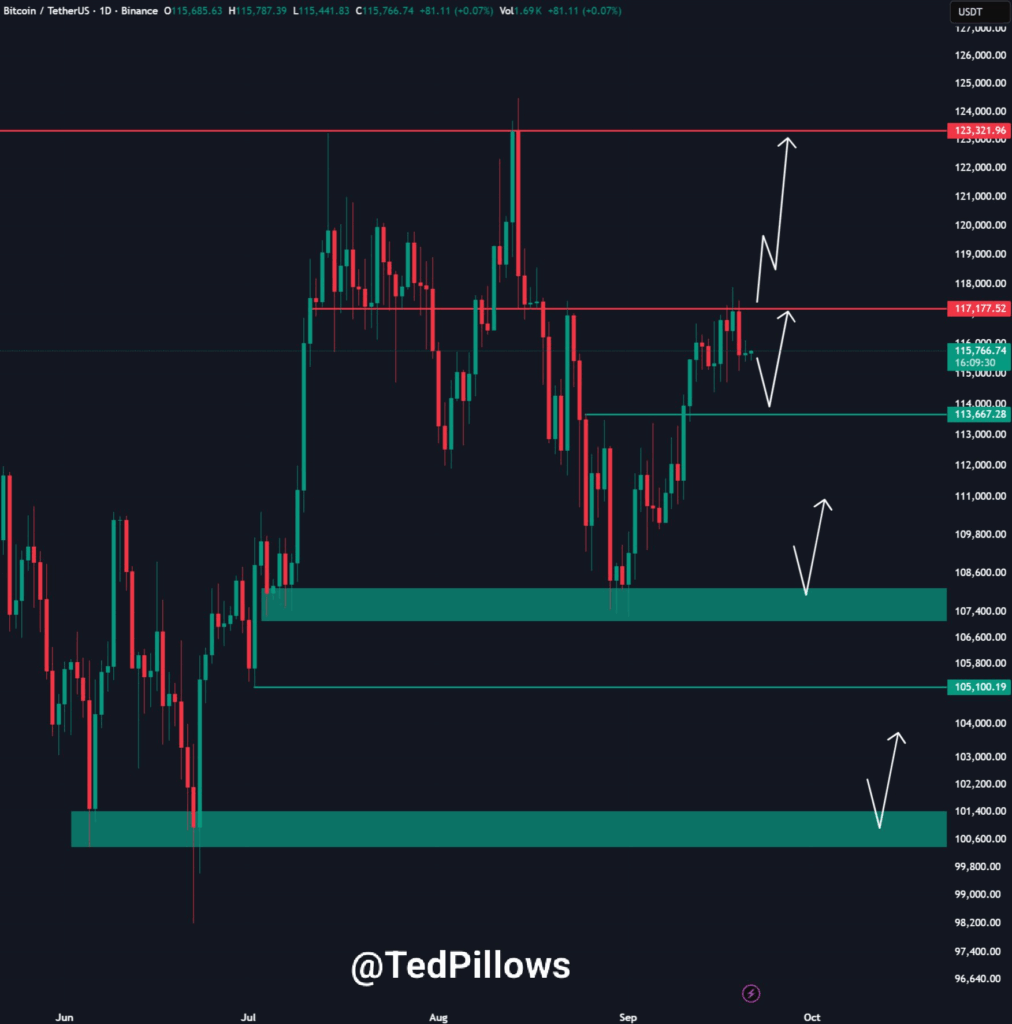
Analyst Ted Pillows said Bitcoin needs to break above $117,000 to move higher. If the buyers can maintain their momentum, its price may move towards $123,000.
Otherwise, there will be a decline before an upturn later in the next quarter. His perspective lays emphasis on the significance of immediate price levels on the movement of Bitcoin.
Source: X
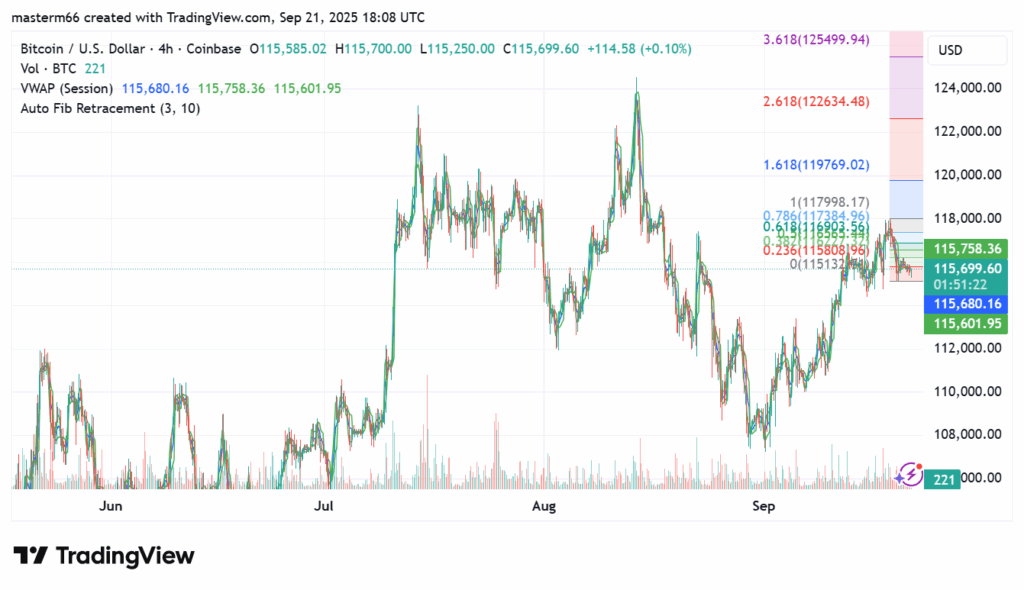
Important levels of Fibonacci retracements and VWAP are shown by TradingView data. Increased retracement ranges are associated with the resistances at $117,384 (0.786 Fib.), $119,769 (1.618 Fib.), and $122,634 (2.618 Fib.).
These areas are pivotal price points for when there’s a breakout by Bitcoin. Any move higher than $117,800 may give it accessibility to $120,000, and rejection may cause it to drop to $115,000. Technicals show that there are signs of short-term bearishness. But institutional demand, such as purchases by Strategy, offers a bullish foundation.
Source: TradingView
Also Read | Bitcoin Price Faces Resistance at $116K: Can Bulls Regain Control?


