Bitcoin opened September in negative territory, breaking below the $78,000 zone after having appreciated nearly 25% during August. This initial price action coincides with a calendar marked by high-impact macro events: the probability of a new Federal Reserve rate hike stands at 66%, the 10-year Treasury yield has reached its cycle high of 4.78%, and the conflict in the Middle East has pushed Brent crude above $90 per barrel.
The macroeconomic context constitutes the primary headwind for risk assets. Federal Reserve Chairman Kevin Warsh’s remarks at the Jackson Hole symposium left no room for dovish interpretation. Warsh characterized current financial conditions as “not accommodative” and reiterated that underlying inflation remains well above the 2% target. This stance has reshaped market expectations, pushing the federal funds rate to a projected range of 4.00-4.25% by year-end.
For Bitcoin, an asset that competes directly with bond yields, this dynamic implies an increase in opportunity cost and greater dollar strength, factors that have historically exerted downward pressure on its price.
The U.S. strike against Iranian targets in the Strait of Hormuz, followed by Iran’s missile response against a base in Jordan, has raised the energy risk premium. WTI crude exceeds $88, fueling fears of secondary inflation that would force central banks to maintain a restrictive stance for longer.
This “dual risk” scenario—high rates coupled with geopolitical conflict—reduces appetite for speculative positions and favors liquidity, exerting downward pressure on Bitcoin’s price as it seeks solid support in the $75,000 zone.
However, on-chain analysis reveals an internal reality that contrasts with the adverse external environment. Data from CryptoQuant shows a pattern of aggressive accumulation by whales. Addresses holding between 100 and 1,000 BTC have accumulated over 73,000 BTC in the last 60 days, marking the highest buying rate since April.
Even more relevant is the behavior of super-whales—those with holdings exceeding 10,000 BTC—who have increased their positions by over 43,000 BTC during the same period. This activity suggests that smart money perceives the current price range as a value zone, despite the macro noise.
This accumulation pattern correlates with a steady decline in BTC reserves on exchanges. The total balance on trading platforms has fallen to its lowest level since late 2023, around 2.72 million BTC. This reduction in available liquid supply is a technical indicator of strength, as it removes immediate selling pressure. However, a significant divergence is observed in retail behavior: addresses with balances below 1 BTC have reduced their holdings, recording net outflows.

From a technical perspective, the weekly chart presents a scenario of maximum tension. Price sits just below the 50-week simple moving average, located at $81,000. This level is not a simple support or resistance; it acts as a primary trend filter. History shows that sustained breaks above this average have marked the beginning of prolonged bullish markets, while rejections at this level have led to deep corrections. The zone between $80,000 and $81,000 constitutes the critical control point that will define the trend for the fourth quarter.
In the short term, oscillators warn of possible trend exhaustion. The daily RSI approaches overbought territory at 71, while the MACD has registered a bearish crossover on the 4-hour chart, signaling a loss of bullish momentum. The stochastic indicator shows a similar configuration, with the %K line (84) above %D (67), anticipating a potential bearish crossover. These signs of technical weakness, combined with the rejection at the $79,400 zone (upper Bollinger Band on the 4-hour), increase the probability of a test of lower supports at $76,977 and, in case of a break, the psychological $75,000 level.
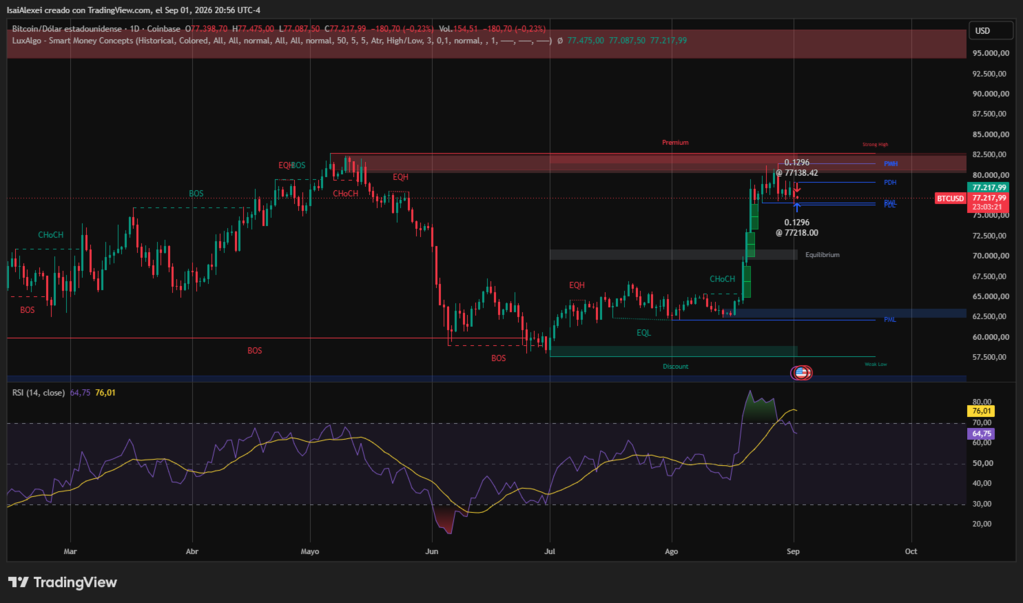
U.S. spot Bitcoin ETFs broke a nine-day streak of net inflows with an outflow of $202 million last Friday. This shift in flow occurred almost simultaneously with the price pullback from the $81,000 level. Although ETF demand has been a fundamental pillar of August’s recovery, its volatile nature means it cannot be considered an unconditional support anchor. The ability of these vehicles to attract new capital will largely depend on the evolution of bond yields and monetary policy expectations.
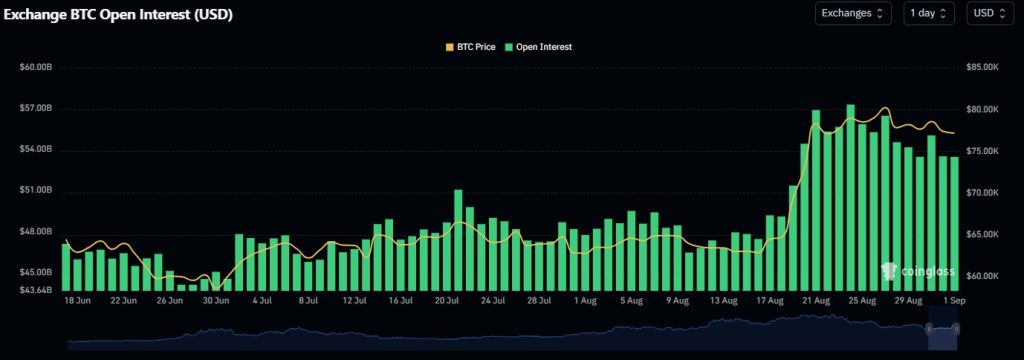
The funding rate for perpetual contracts remains at moderate levels, around 0.0085% per 8 hours, indicating that the market is neither over-leveraged short nor long. Open interest has increased slightly to $255 billion, suggesting traders are rebuilding positions following August’s liquidations. However, the long-short ratio among elite traders shows a slightly positive bias of 1.07, but without reaching euphoric levels. This market structure, with moderate leverage, reduces the probability of a cascade liquidation but does not eliminate the risk of a technical correction if key supports are breached.
Historical data since 2013 indicates that September is the worst-performing month for Bitcoin on average, recording only five positive monthly closes. This pattern, colloquially known as “Rektember,” responds to capital flow factors where the Northern Hemisphere summer reduces liquidity and institutional investors adjust portfolios before the final quarter. Added to this, the release of the Non-Farm Payrolls report on September 4 and the CPI data the following week will act as volatility catalysts that could exacerbate the seasonal move.
The first, with an estimated probability of 40%, contemplates a bullish continuation. For this scenario to materialize, price must close above $80,127 on daily timeframes, supported by sustained buying volume and a relaxation of geopolitical tensions. In this case, the next target would be the major resistance in the $82,500 zone, with projections toward $85,000 if momentum accelerates.
The second scenario, with a similar probability, anticipates a sideways or consolidative move within the $75,000 to $82,000 range. This is the view maintained by Wintermute, which expects price to remain within this channel ahead of the September 15 FOMC meeting. This range allows for digestion of August’s gains and position accumulation by long-term investors without generating an extreme imbalance in the order book.
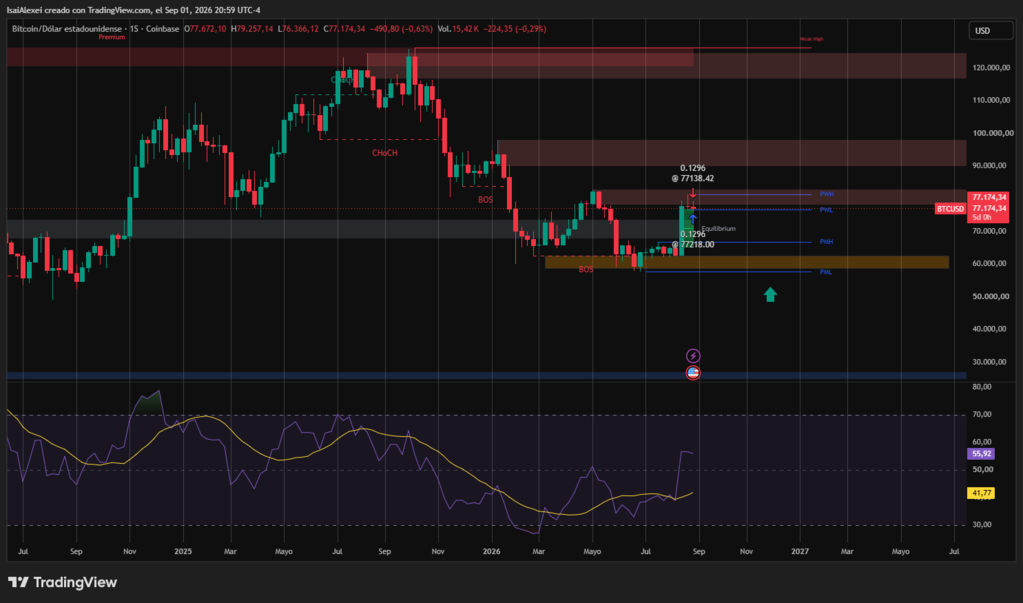
The third scenario, which cannot be dismissed, implies a bearish retreat toward $72,000 or even $70,000. This would be triggered if price loses the $77,000 support and confirms a break below the 50-day moving average at $75,000.
An employment report above expectations, reinforcing the aggressive Fed thesis, would be the primary catalyst. Losing $70,000 would imply a break of the medium-term bullish structure, opening the door to a deeper correction toward $65,000.





