$Bitcoin has officially broken below the $100,000 psychological support, sending shockwaves across the crypto market. The 4H chart shows a sharp rejection from the $104K–106K resistance zone, followed by a steep selloff that accelerated once BTC slipped under the yellow support area.
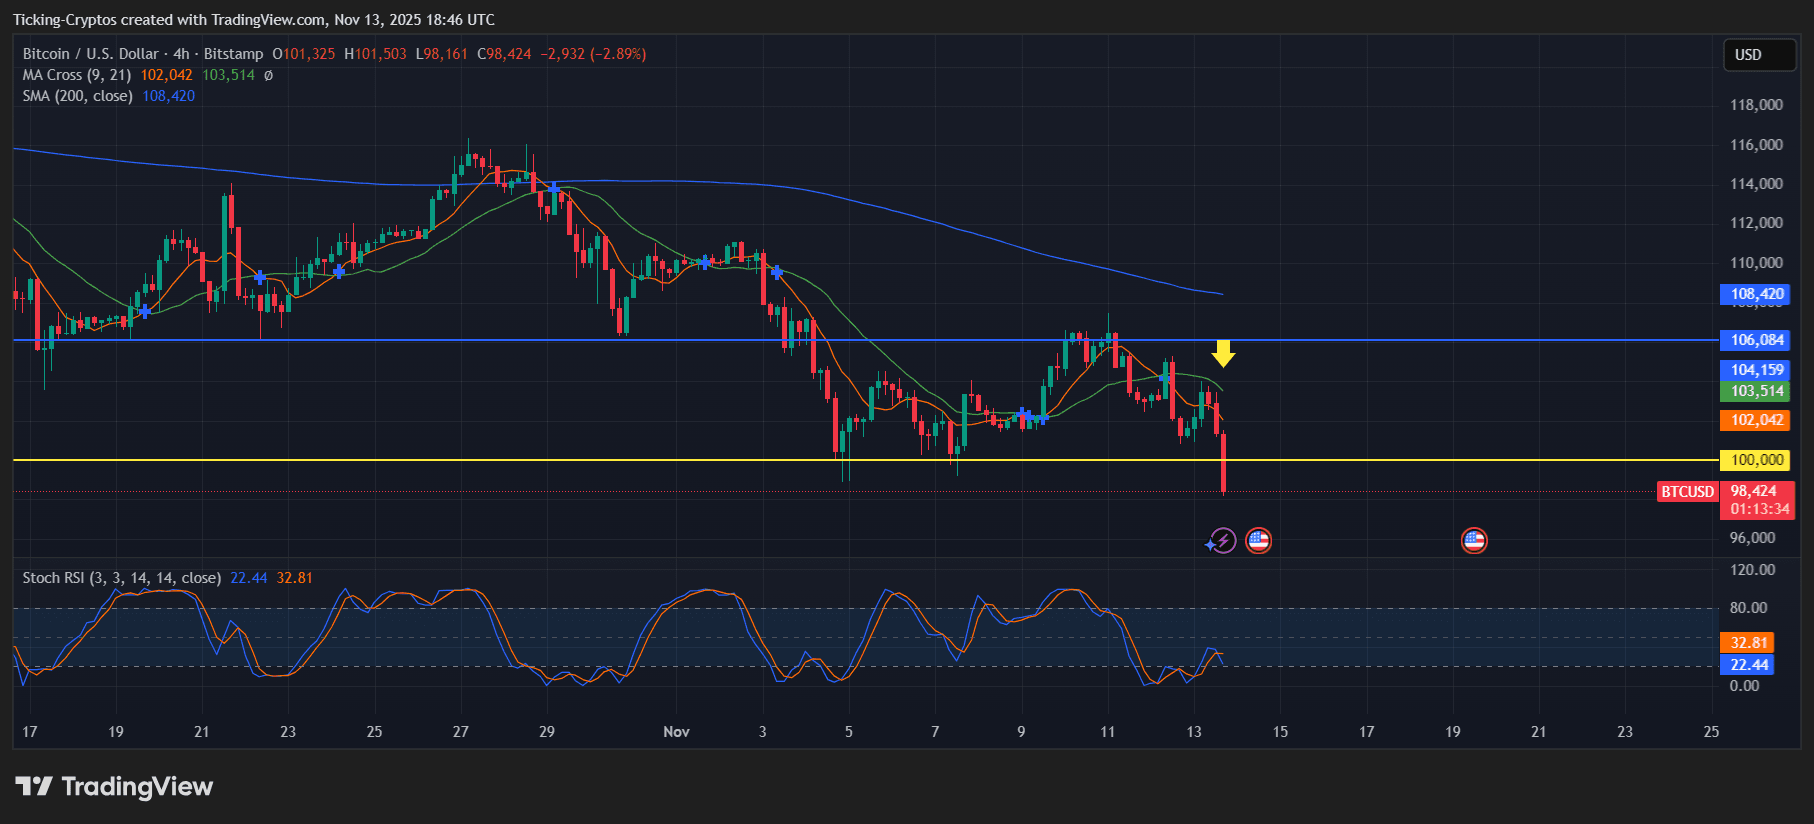
BTC/USD 4-hours chart - TradingView
The break below $100K wasn’t just technical—it triggered panic selling, liquidations, and a massive imbalance in the order book, all visible in the depth chart.
$BTC is now trading around $98,500, with fear rising rapidly as traders reassess downside risks.
On the 4H chart:
The long-tested horizontal zone at $100,000 has acted as:
Once price slipped under it, the market reacted violently.
Stoch RSI is diving into oversold territory, suggesting short-term exhaustion—
…but not enough yet to prevent further downside if liquidity gets swept.
The depth chart clearly shows:
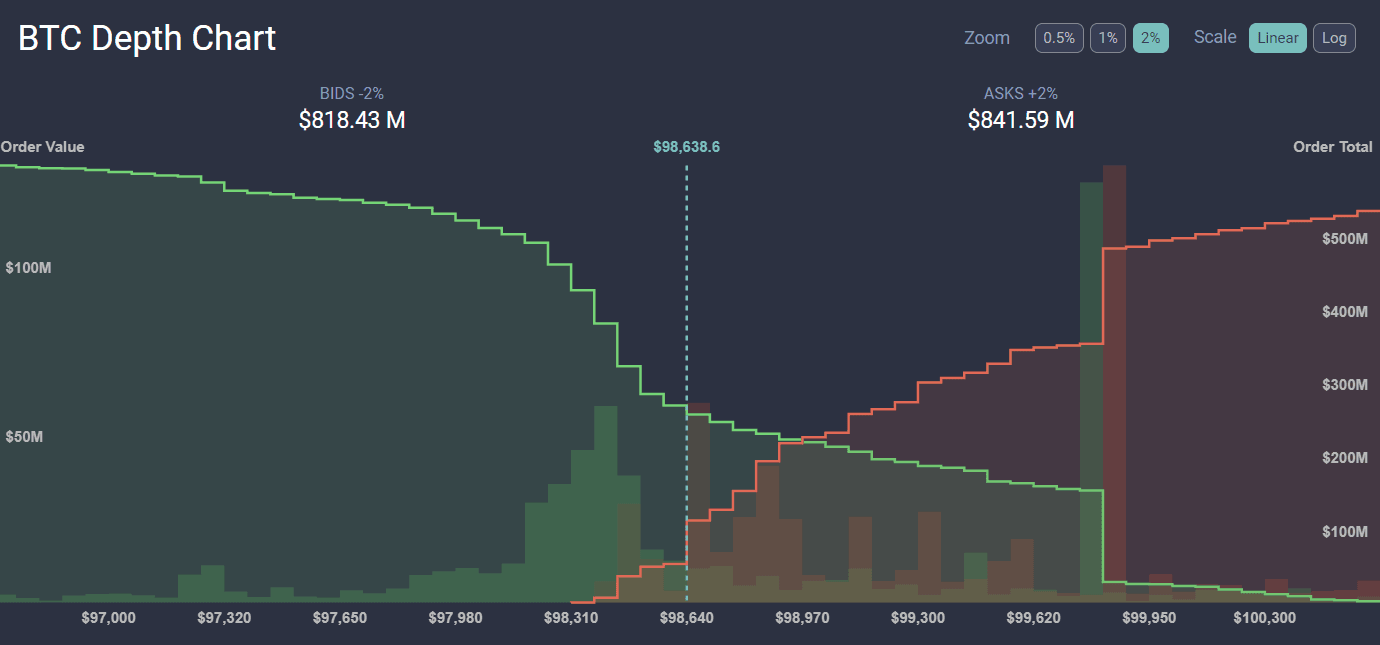
The order book shows a strong imbalance:
🔻 $98,300 – first bounce zone: (This area appears in both the trading chart and depth chart as a large liquidity pocket.)
🔻 $96,000 – $95,500: Stronger buy liquidity zone. If BTC continues falling, this is the next major support.
🔻 $92,000 – $90,000: A complete liquidity sweep may target this region if panic selling accelerates.
If BTC manages to reclaim $100K:
🔼 $102,000 – $103,500: First resistance cluster (21 EMA + sell wall)
🔼 $104,000 – $106,000: The key area where BTC was previously rejected. Must be broken to regain bullish structure.
🔼 $108,400: 200 SMA resistance on the 4H—major trend confirmation point.
The break below $100K triggered:
However, structurally:

