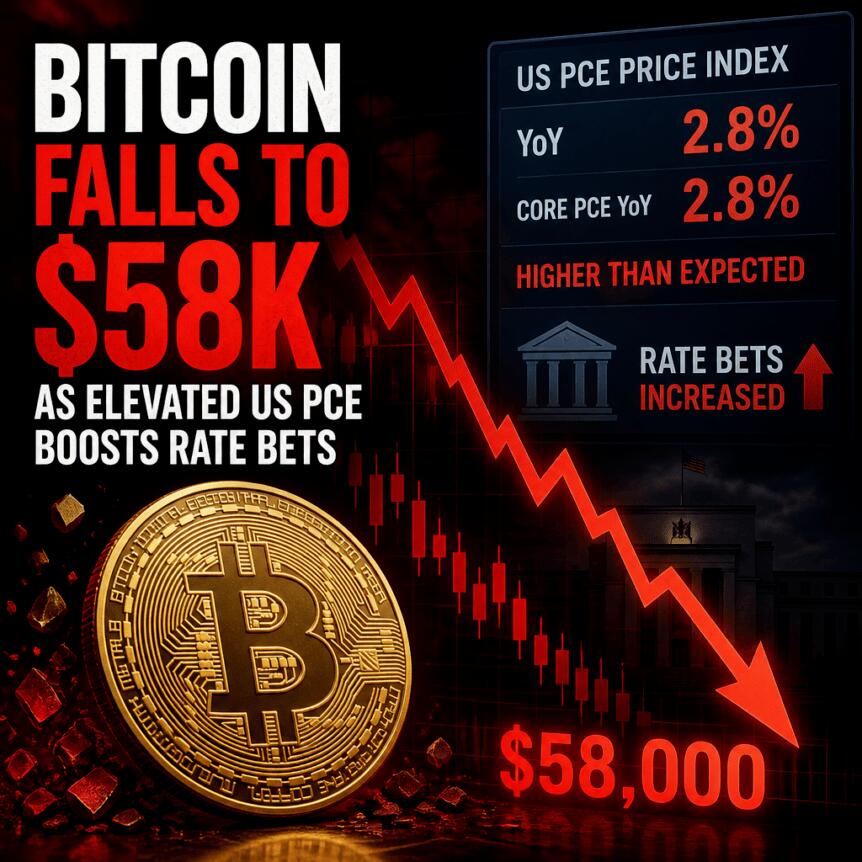
Bitcoin slid to fresh 21-month lows Thursday at the Wall Street open, falling back toward the $58,000 area as a hotter-than-expected US inflation print rattled risk assets. The move underscored how tightly BTC trading has been tied to broader market volatility when macro data hits.
According to TradingView data cited in the report, BTC/USD on Bitstamp dipped to $58,035—an area last seen in September 2024. The pressure intensified shortly after the release of the May Personal Consumption Expenditures (PCE) report, with equities swinging sharply at the open.
The catalyst was the May PCE inflation release. The Bureau of Economic Analysis (BEA) reported that the PCE price index rose 4.1% year over year in May—recording a three-year high. In the monthly comparison, BEA said the PCE price index increased 0.4%, while excluding food and energy it rose 0.3%.
“From the same month one year ago, the PCE price index for May increased 4.1 percent. Excluding food and energy, the PCE price index increased 3.4 percent from one year ago.”
Markets reacted quickly. The report notes that the Nasdaq 100 dropped about 2% within roughly 30 minutes at the open, while the Nasdaq Composite was down modestly around the time of writing. The S&P 500, by contrast, managed a small gain—highlighting dispersion between large-growth and broader benchmarks as investors repriced near-term rate expectations.
Bitcoin’s decline mirrored that “risk-off” impulse. In the minutes after the open, BTC pushed lower in a move that traders often interpret as forced positioning rather than purely discretionary selling—especially given what followed in the derivatives market.
As BTC slid through key levels, derivatives leverage appears to have accelerated the down move. CoinGlass, as referenced in the coverage, logged cross-crypto liquidations totaling more than $600 million over a single hour.
That kind of liquidation burst typically happens when price moves trigger margin calls for leveraged long positions, forcing liquidations that mechanically add to selling pressure. It also tends to increase volatility, making support levels harder to defend in the short term.
The report also included commentary from market participants who suggested the drop may have been intensified by order-book dynamics. A pseudonymous trader identified as “Killa” told X followers that BTC was in a “manipulation phase,” arguing that trading below $60,000 corresponded with a notable “swing low” region and that the orderbook was “stacked below” current pricing.
Beyond the immediate macro-driven move, the article frames the latest dip within a broader bear-market pattern. Crypto analyst and trader Niels Klaver, cofounder of STABL Agency, characterized BTC/USD as moving toward what he called the “final leg down” of the current bear market. Klaver referenced a short-term target of $55,000, aligning with earlier popular bearish scenarios circulating among traders.
Other technical commentary focused on whether the market can stabilize after breaking below a key psychological level. The report cites Rekt Capital saying $60,000 support is “clearly weakening,” implying that any attempted rebound may face selling pressure from participants who sell after a breakdown or re-test.
Rekt Capital also pointed to the idea that the current market is behaving similarly to 2022, noting that a widely watched trend indicator—the 50-month exponential moving average (EMA)—is expected to become a resistance area. While that does not guarantee a rejection, it gives investors a concrete “where would resistance show up?” reference point if BTC tries to reclaim higher levels.
Another development highlighted in the report: Rekt Capital suggested that once June’s monthly close arrives, traders will be better able to judge whether July could produce a relief rally “from which price” the market can potentially pivot. This matters because monthly closes often influence how traders assess trend structure, risk management, and the probability of a reversal versus continued breakdown.
For investors and traders, the immediate question is whether BTC can regain and hold above the broken support zone around $60,000, or whether it turns into resistance as liquidation effects dissipate. The report’s cited technical views also imply that any rebound attempt could encounter selling pressure closer to the $65,000 area, with the broader bear-market analogy keeping downside risk in focus.
Going forward, the next macro releases and—just as importantly—whether the market sees sustained follow-through on either side of $60,000 and toward the $55,000 target will likely determine if this is a continuation leg or a transition into consolidation.
This article was originally published as Bitcoin Falls to $58K as Elevated US PCE Boosts Rate Bets on Crypto Breaking News – your trusted source for crypto news, Bitcoin news, and blockchain updates.

