Bitcoin’s recent slide from above $82,000 to $59,200 has been one of the sharpest corrections of the year.
As ETF outflows accelerated and leveraged positions got flushed from the market, traders were left wondering whether the sell-off had further to go or was nearing exhaustion.
This week’s Chart Decoder explores Parabolic SAR through the lens of Bitcoin’s latest correction. Using real BTC price action, we explore how the indicator tracked the downtrend, how it reflected changes in momentum, and how traders can use it to spot early signs that a trend may be losing steam.
Parabolic SAR was developed by J. Welles Wilder, the same technical analyst behind RSI and ATR. It stands for Parabolic Stop and Reverse. The idea is simple: the indicator helps traders track the direction of a trend and identify where that trend may reverse.
On your chart, Parabolic SAR appears as dots.
As long as the dots remain on the same side of price, the trend is considered intact. When price crosses the dots, the indicator flips to the opposite side, signalling that momentum may be shifting.
In an uptrend, a flip above price can suggest buyers are losing control. In a downtrend, a flip below price can indicate that selling pressure is beginning to ease.
Parabolic SAR is one of the easiest indicators to read.
The dots also behave like a dynamic trailing stop.
In a bullish trend, traders often use the dots below price as a level to protect gains. As price rises, the dots rise with it. If price falls below the dots, the trend may be losing control.
In a bearish trend, the dots above price can act as a guide for where selling pressure remains intact. If price breaks above the dots, sellers may be losing control.
The dots do not just tell you the direction of the trend. Their spacing can also reveal how the trend is evolving.
Why does this happen?
Parabolic SAR uses an “acceleration factor” that increases as a trend continues. As momentum builds, the indicator becomes more aggressive and the dots begin moving faster, creating larger gaps between successive dots.
Dot spacing is a momentum clue, not a trading signal by itself. Always combine it with price structure, support and resistance, or indicators like RSI and MACD for confirmation.
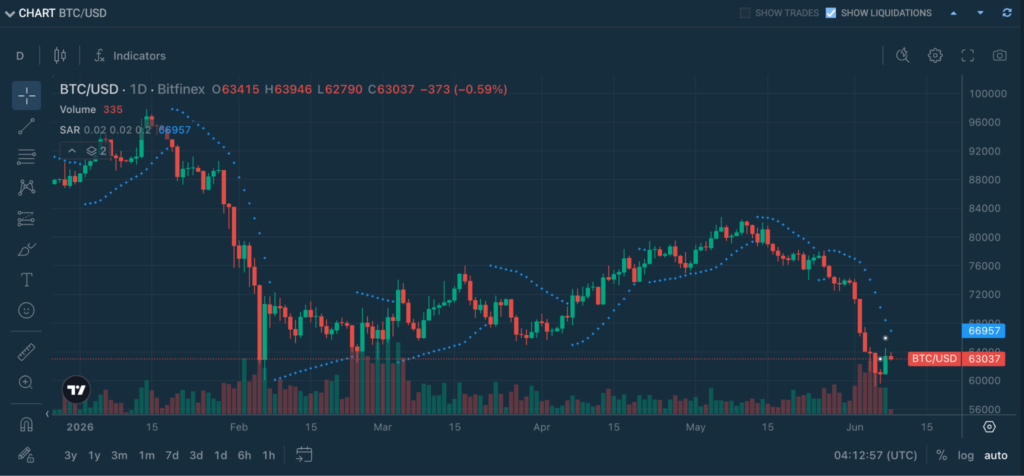
Let’s look at BTC/USD on the daily timeframe on June 8, 2026.
The key question now is whether bulls can reclaim control. A move back above the SAR level and a fresh bullish flip would suggest buyers are regaining momentum. Until then, Parabolic SAR suggests the short-term trend remains bearish.

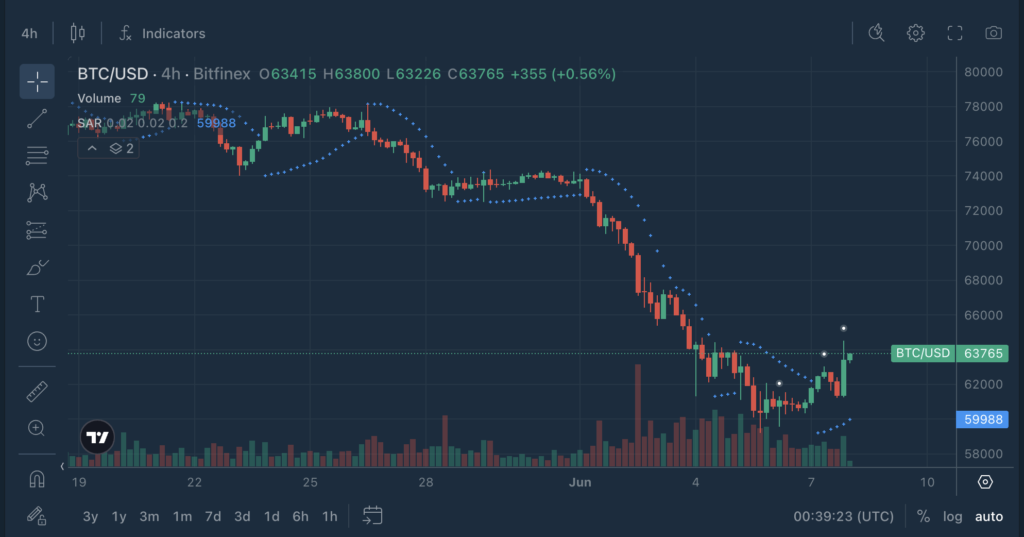
While the daily chart remains under pressure, the 4-hour chart shows the first signs that short-term momentum may be shifting.
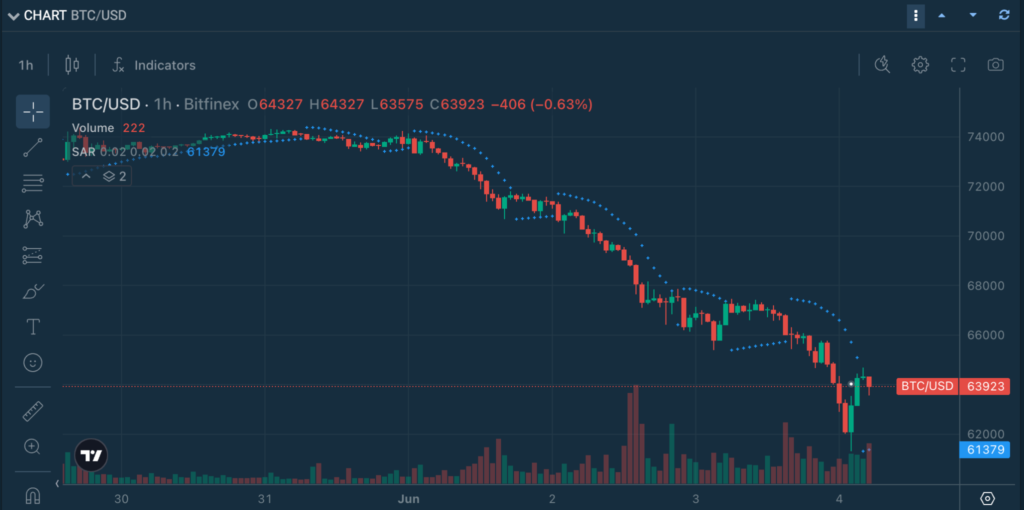
Throughout a sharp decline from the $74,000 region toward the $60,000 zone, the Parabolic SAR dots remained firmly above price, confirming that sellers controlled the trend throughout most of the move. During the strongest part of the sell-off, the spacing between the dots widened, reflecting accelerating downside momentum.
As the decline began to slow, however, the dots moved progressively closer to price and to one another. This narrowing gap suggested that bearish momentum was fading, even though the trend remained down.
More recently, the indicator flipped, with the dots moving below price as BTC rebounded from the lows near the $60,000-$61,000 support zone. While a previous bullish flip in early June quickly failed and reverted back to a bearish signal, the latest flip has so far been accompanied by stronger follow-through, with price continuing to push higher and create some distance from the SAR dots. This suggests buyers may be exerting greater control than they did during the previous recovery attempt.
This does not necessarily mean the broader correction is over. Short-term bullish flips can occur within larger downtrends and sometimes fail if buying momentum cannot sustain itself.
While the signal suggests momentum may be shifting, one indicator alone is rarely enough to confirm a lasting trend reversal. What traders will want to see next is stronger price structure, continued support from buyers, and follow-through in the sessions ahead. If it can, the bullish signal may strengthen. If price falls back below the SAR dots and triggers another flip, it would suggest the recent bounce was merely a temporary relief rally.
Parabolic SAR is built for momentum. Parabolic SAR works best in trending markets. When the price is moving clearly higher or lower, the indicator can help traders stay with the move and avoid exiting too early.
When the price is choppy, the dots can flip above and below. The indicator may flip too often and create false signals.
This is one of the cleanest ways to use Parabolic SAR.
A SAR flip at a key level matters more.
Moving averages help define the bigger trend. Parabolic SAR helps with timing.
RSI tells you whether the market is stretched. Parabolic SAR tells you whether momentum is flipping.
MACD helps confirm momentum shifts.
Support and resistance give the signal a location.
This helps traders avoid treating every flip as equal.
Button: See Parabolic SAR in action: https://trading.bitfinex.com/t?type=exchange
Bitfinex. Master Your Universe.

Explore the full Chart Decoder library:
The post Chart Decoder Series: Parabolic SAR: How Traders Spot Potential Trend Reversals appeared first on Bitfinex blog.

