

Bitcoin’s push back above the $80,000 area has revived the $100,000 debate, with traders now watching whether a fresh weekly MACD crossover can turn the rebound into a multi-month trend.
Crypto analyst Ali Martinez highlighted the setup in a post on X, saying BTC has already gained about 15% since the bullish weekly MACD crossover on April 13. He noted that similar weekly crossovers previously helped define longer rallies, including a 147% move after Oct. 23, a 75% move after Oct. 14, and a 35% move after May 5.
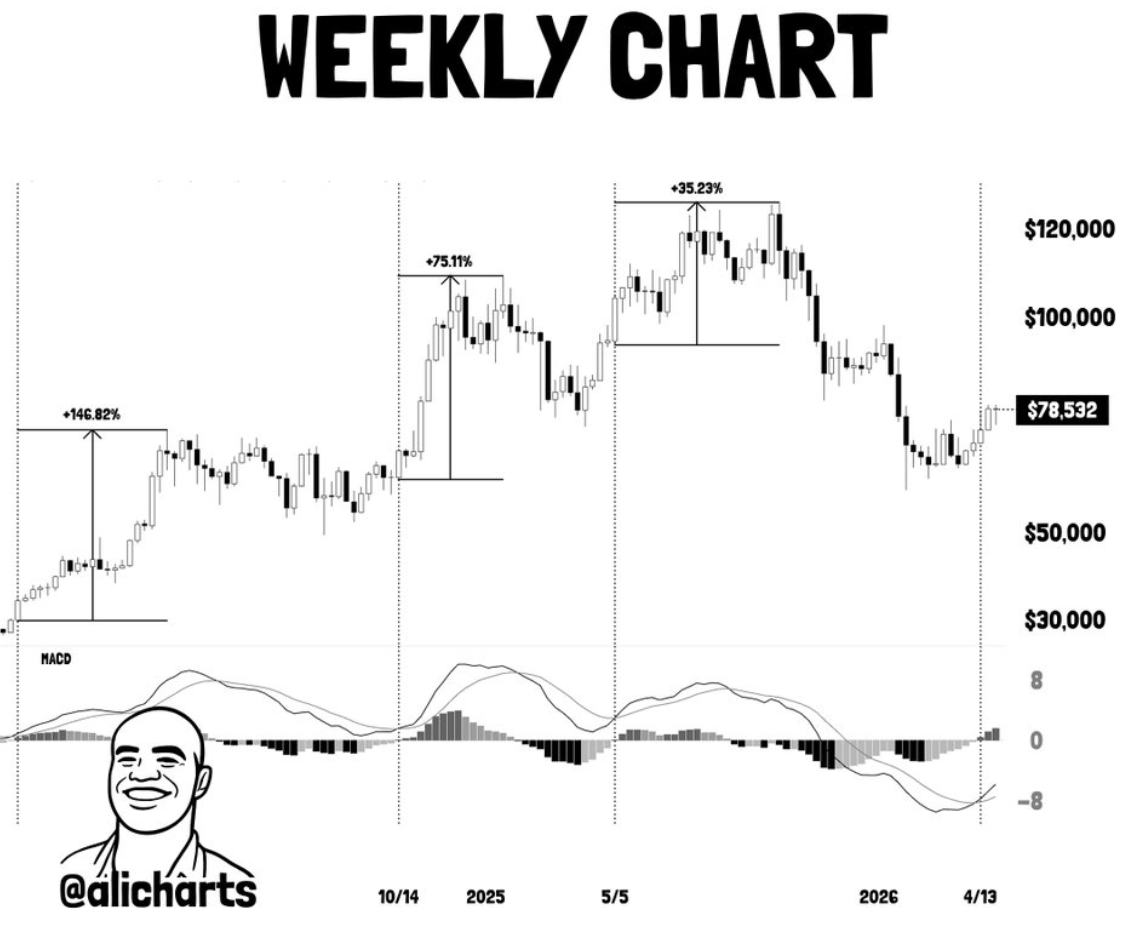
That history makes the latest crossover worth watching, but it does not make $100,000 automatic. MACD signals work best when momentum, liquidity, spot demand, and higher-time-frame resistance all align. Bitcoin has already reclaimed a major psychological level near $80,000, but the chart still has a larger barrier ahead.
The most important level on the daily chart is the 200-day simple moving average near $83,000. Martinez called it the key psychological and structural hurdle, and that framing fits the current market. A daily close above that level would confirm that Bitcoin is not only recovering from the spring drawdown, but also pushing back into a broader bullish structure.
If BTC clears $83,000 with strong volume, the next upside zone sits near $89,000. A continuation through that area would shift attention toward $94,000, where traders are likely to watch for profit-taking and deeper supply from holders who bought closer to prior highs. From there, $100,000 becomes a realistic macro target again, but the path still needs confirmation rather than expectation alone.
The downside levels are just as important. If Bitcoin fails to hold the $80,000 area, the move risks turning into another breakout attempt that loses strength near resistance. A recent Bitcoin market snapshot tied the latest rally to stronger ETF flows, improving risk appetite, and Bitcoin’s return above the key round-number level. Those same flows need to stay supportive if BTC is going to challenge the 200-day average instead of slipping back into range.
The caution signal comes from market participation. Bitcoin’s price is stronger, but recent on-chain activity data showed active addresses and new wallet creation falling to two-year lows. Earlier spot-volume data also pointed to thinner exchange activity even as BTC pushed toward resistance.
That does not cancel the bullish technical setup. It does mean the rally may still be relying more on ETF demand, derivatives positioning, and large buyers than broad retail or on-chain participation. A cleaner move toward $89,000 and $94,000 would look stronger if spot volume expands and new wallet activity begins to recover alongside price.
Bitcoin now has a credible technical roadmap, but the $100,000 conversation still has steps in front of it. The weekly MACD has given bulls a higher-time-frame momentum signal, the $80,000 reclaim has improved sentiment, and the 200-day average near $83,000 is where the chart can turn from recovery into expansion. A strong close above that level would put $89,000 and $94,000 back in play, while a weak rejection would leave $100,000 as a headline target rather than a confirmed market path.
The post Bitcoin’s $100K Path Runs Through The $83K 200-Day Average appeared first on Crypto Adventure.

