
Bitman called Arbitrum “the best ETH eco by a million miles” in a recent post on X. The statement echoed rising sentiment across the market, where participants are now watching closely for a potential breakout. ARB has already pushed above $0.44, forming a clear ascending channel, and with several bullish chart structures developing, some participants believe it could be the start of something much bigger.
Arbitrum is currently trading within a well-defined ascending channel, with the price recently pushing above the $0.44 level. As outlined by analyst Tom B, the next critical resistance sits near $0.5176, an area that could either spark continuation or rejection depending on market conditions. If momentum holds and bulls clear this level, the uptrend could re-accelerate, targeting the higher boundary of the channel and possibly setting up a retest near $0.55 to $0.57 down the line.
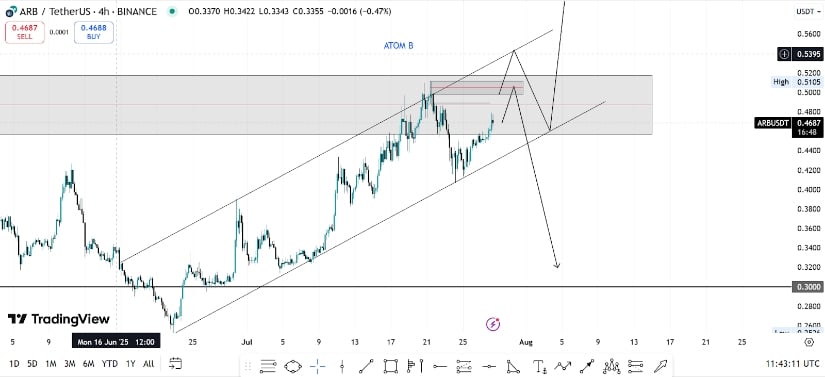
Arbitrum trades within a rising channel as it challenges key resistance near $0.51, setting the stage for its next major move. Source: Tom B via X
On the flip side, failure to sustain above current levels may invite a pullback toward the lower band of the channel, with $0.44 acting as a key decision point. A breakdown below that could expose ARB to deeper downside, potentially revisiting the $0.30 zone. With both scenarios in play, volume and reaction around the midline will likely determine whether the next leg is an extension or a retracement.
Newer insights from analysts Aris and Smcapitalclub present two very different short-term perspectives. Crypto analyst Aris leans bullish, sharing a long-term weekly chart where ARB appears to be stabilizing after an extended downtrend. The range between $0.44 and $0.50 is being treated as a base-building zone, and should ARB Arbitrum price push through this accumulation band, the chart shows potential upside targets as high as $1.23 and even $2.65, reflecting prior macro levels.
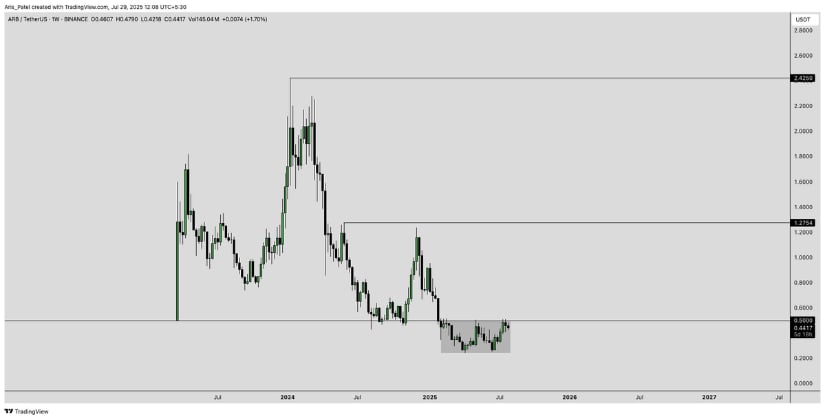
Aris shares a long-term weekly chart showing ARB stabilizing in a base zone between $0.44 and $0.50, with upside targets at $1.23 and $2.65. Source: Aris via X
On the flip side, Smcapitalclub highlights a more cautious tone, pointing to “dynamic liquidity” resting underneath ARB’s current price. Their 6H chart outlines a potential breakdown from the ascending structure, with a yellow path projecting a move toward the $0.32 to $0.34 liquidity zone. This implies that any weak bounce or rejection near current levels could trigger a sweep of lower supports before finding true demand.
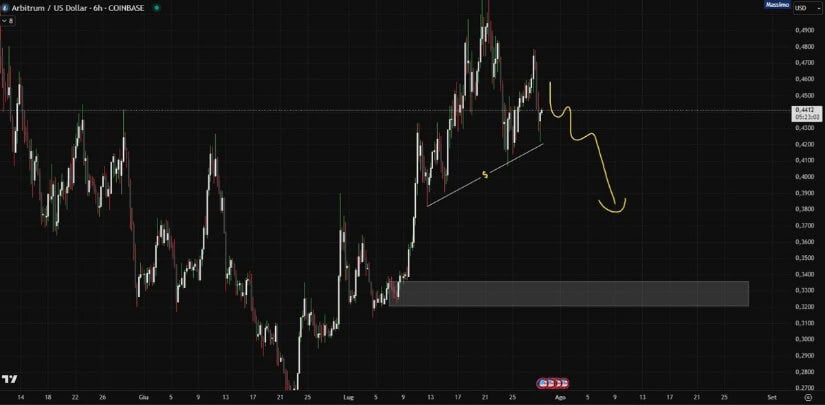
Chart outlines a possible breakdown toward the $0.32–$0.34 zone, highlighting key liquidity resting below. Source: Smcapitalclub via X
Together, these charts frame a classic mid-range tension setup. While the weekly timeframe suggests ARB may be forming a larger base that could evolve into something more bullish, intraday risks remain. Until Arbitrum price reclaims $0.48 to $0.51 with conviction, the risk of short-term liquidity grabs to the downside will likely persist.
While charts remain mixed in the short term, Arbitrum’s on-chain fundamentals are undeniably gaining strength. As noted by ShinoXBT, the network just recorded an all-time high of over 20.28 billion ARB in net inflows for July, a strong signal of growing conviction among participants.
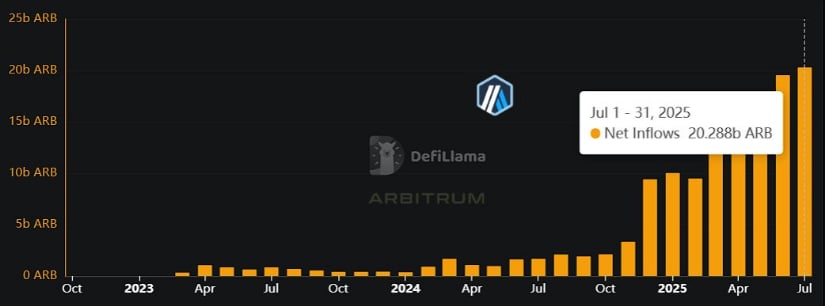
Arbitrum posts over 20.28B ARB in July inflows and $837B in trading volume. Source: ShinoXBT via X
Perpetuals trading volume also surpassed $837 billion, reinforcing Arbitrum’s standing as a major liquidity hub. More notably, the narrative now appears to be shifting toward institutional adoption and real-world asset (RWA) infrastructure. While retail sentiment continues to wrestle with range-bound price action, these emerging fundamental triggers could provide the push needed to kickstart the next move.
Building on the recent fundamental strength, analyst CryptoSmith0x brings a longer-term perspective into focus with a clean breakout from a weekly falling wedge. As shown in the chart, Arbitrum has broken above the descending trendline resistance. With price now curling upward and maintaining structure above the $0.46 mark, the setup adds weight to the broader bullish narrative.
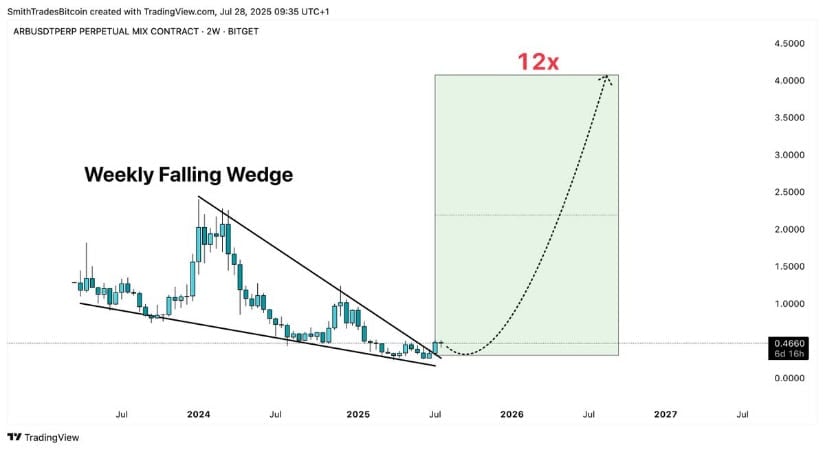
Arbitrum breaks out of a weekly falling wedge, with bullish targets aligning from $0.51 to a potential 12X move. Source: CryptoSmith0x via X
This formation aligns well with previous H2 levels, including the $0.51 resistance from Tom B’s ascending channel outlook and the $1.23 macro zone highlighted by Aris. If the wedge follows its historical pattern, the Arbitrum price prediction may be leaning toward a significant 12X move in the long term.
Despite the mixed short-term signals on lower timeframes, Arbitrum’s broader structure is beginning to favor bulls, especially with the weekly falling wedge breakout and rising on-chain momentum. The key resistance at $0.51 remains pivotal. If bulls reclaim and defend this level, it could mark the start of a broader trend, lending real weight to the long-term Arbitrum price prediction targeting $1.23 or even beyond.
That said, the full 12X upside remains a longer-term vision and would require far more growth within the Arbitrum ecosystem itself. Increased developer activity, real-world adoption, and deeper institutional involvement will be essential to fuel such a rally.

