Bittensor (TAO) completed a rounded bottom on its 4-hour chart on Thursday, March 5, signaling a potential shift from distribution to accumulation, according to crypto analyst Alpha Crypto Signal.
This formation indicates waning selling pressure and growing buyer interest, creating a solid foundation for a potential bullish move. Rounded bottoms often precede upward trends, suggesting that TAO may have established a reliable base for a new rally in the near term.
The recent breakout above the neckline pushed TAO past the $185–$188 support zone and the 50-period SMA and EMA cluster, confirming a momentum flip.
This technical signal suggests that buyers have regained control, overcoming previous resistance. Following the breakout, the price pulled back slightly, a healthy retracement that now tests the support zone, reinforcing the structure of the bullish reversal.
Also Read: Bittensor (TAO) Descending Channel Breakout Could Trigger Rally to $480
Support levels of $185$-$188 are vital for the upcoming moves of TAO. As long as new higher lows keep appearing, the chances of reaching the levels of $200$ and then $215$ keep increasing.
The current retest is viewed as a buy opportunity, while a break below the levels of $178$-$180 might negate the pattern, leading to a move towards the base of the rounded bottom pattern.
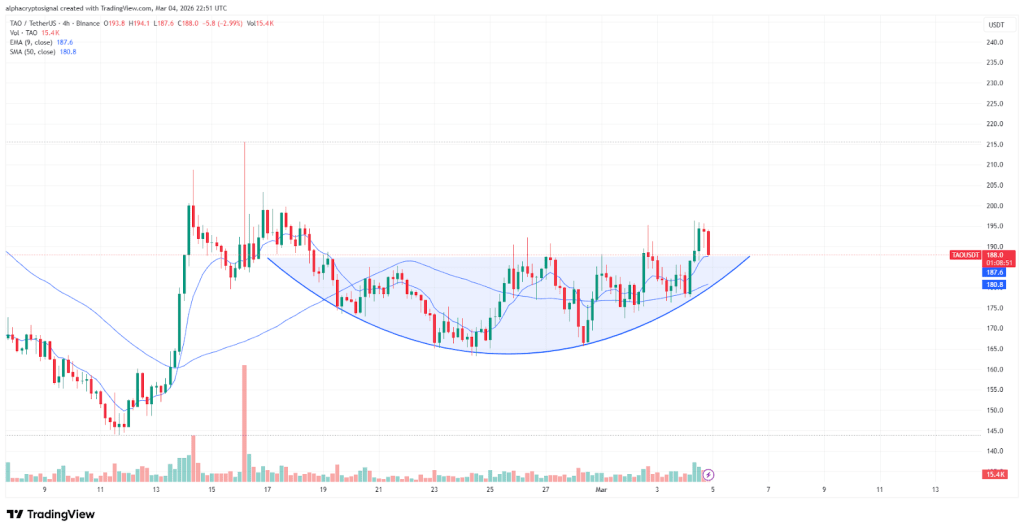
Source: Alpha Crypto Signal’s X Post
The market sentiment remains bullish as long as the support level is defended by the buyers. Additionally, momentum indicators suggest that TAO is ready to move upwards again if the retest is successful.
Everyone is looking at this situation and analyzing whether a springboard is being created for the next move in this emerging bullish trend.
According to TradingView as of Thursday, March 5, the RSI is currently at 53.56, rising steadily above the signal line of 46.63. This indicates that the level of bullish momentum is rising as the RSI enters the upper half of its range.
However, as it remains far below the 70 level, which indicates an overbought market, there is still much room for price to appreciate before the buying pressure runs out.
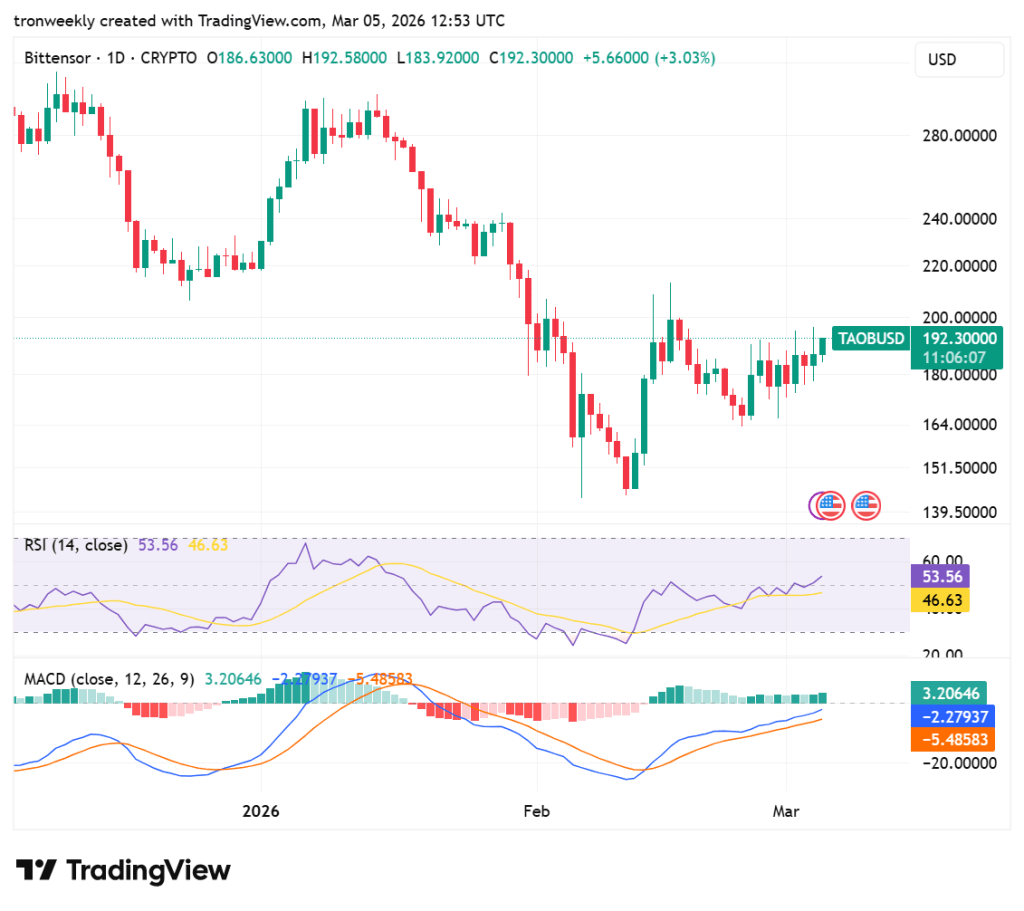
Source: TradingView
The MACD confirms this recovery because it has a blue line that crossed above the orange signal line. The MACD is currently at 3.206 and is trending towards the zero baseline, while the histogram shows consistent green bars.
This indicates that the downward momentum is gone, and the short-term price strength is leading the asset to its recent recovery highs.
Also Read: Bittensor (TAO) Rebounds From Key Trendline, Eyes $214 Breakout Level