
Bittensor (TAO) remained under pressure as price action hovered near a key support zone. Market activity slowed across sessions. Traders continued to monitor whether the structure would stabilize or extend lower.
As of writing, Bittensor (TAO) trades at $262.13 on Monday, April 13, 2026, marking a 4.09% daily decline. Market activity weakened during the session. Trading volume fell 17.04% to $368.88 million, while the token posted a 12.14% weekly loss, according to CoinMarketCap.

Also Read: Bittensor (TAO) Price Consolidation Could Lead to a Strong Rally Toward $482
Analyst More Crypto Online highlighted that TAO reached a support zone and showed a reaction. The analyst noted that a break above $297 would confirm a local low. The current structure still leaves room for another downside move.
The same analysis also identified a probable continuation pattern. Wave five up is a part of the structure under consideration. The described case could take place after one more low form in the existing range.

Additionally, another analyst, Javon Marks, mentioned that TAO has positive structure due to breaking out of the falling wedge pattern. The breakout continues to be valid regardless of a pullback.
According to analysts, the present structure allows setting sights on a further increase. The target is located at the $497 price level. It implies an upward move of over 80% from the current price.

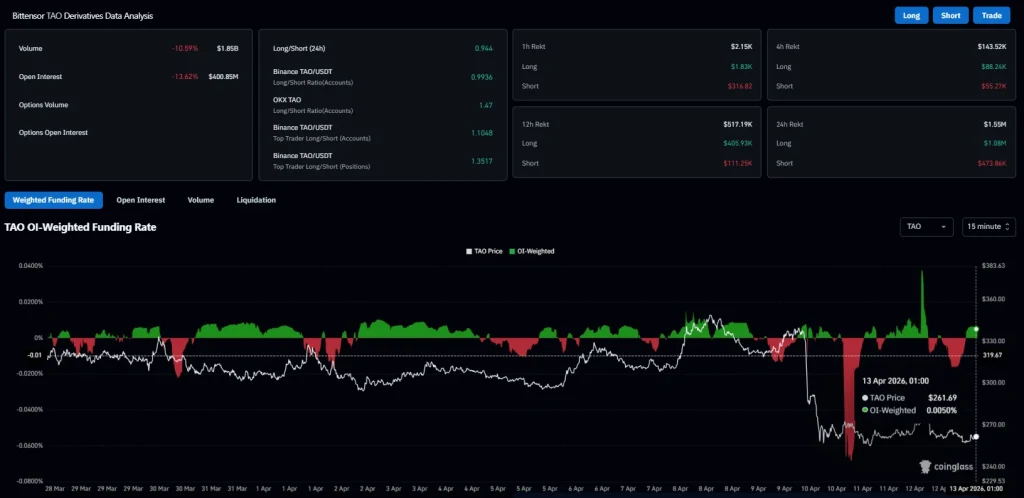
According to CoinGlass data, the future volume increased by 10.59% to $1.85 billion. Open interest has gone down by 13.62% to $400.85 million. The OI-weighted funding rate is at 0.0050%, suggesting limited momentum in terms of leverage.
From a technical perspective, the TAO price continues to remain below key exponential moving averages. The 20-day EMA is at $292.7 and represents immediate resistance. At $269.0, the 50-day EMA is nearer to the current price zone.
At $259.1, the 100-day EMA is now functioning as immediate support. However, at $275.60, the 200-day EMA serves as overhead resistance.
EMA technicals depict the range compression that is being observed at the current price level. A breakout above the $275 and $292 levels may prove helpful for short-term trends. On the contrary, a decline below $259 may expose new levels of support.
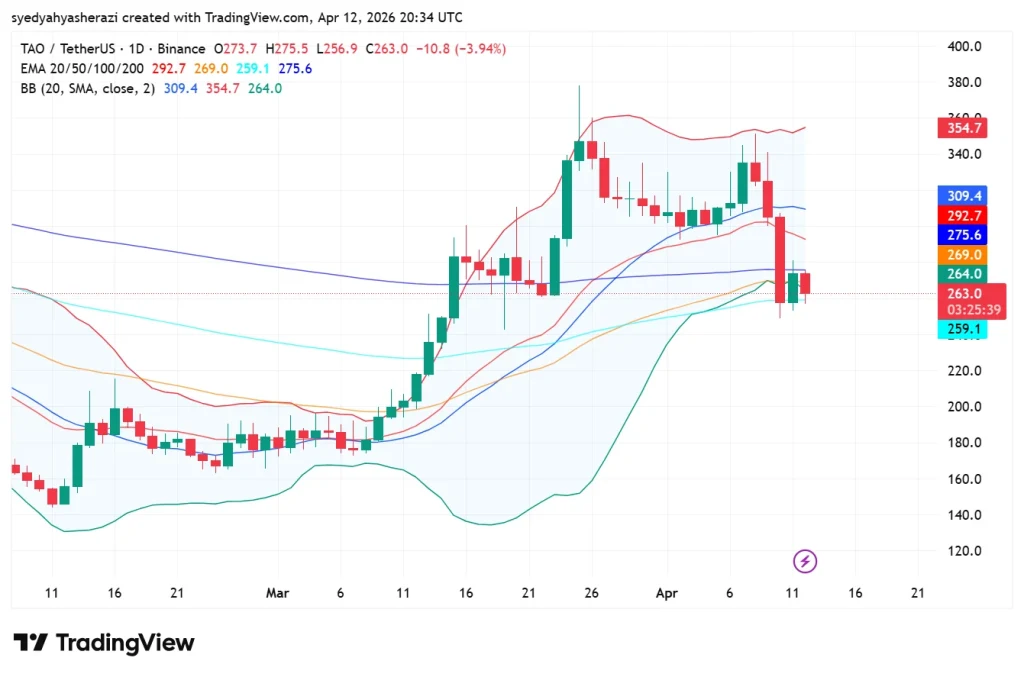
Bollinger Bands currently represent volatility conditions for TAO. The upper band is at $354.7, while the lower band is at $264.0. Middle SMA is close to $309.4, and the price is trading near the lower band.
This article contains market analysis and price predictions. These are not guarantees. Crypto markets are volatile. Always DYOR. Not financial advice.
Also Read: Bitcoin Cash (BCH) Eyes $600 as $420 Support Faces Pressure

