BNB is showing the crypto world who’s boss lately. It has shown incredible endurance during the latest volatility, and for the past 7 days, it’s outperforming every other major coin. Just look at the image below:
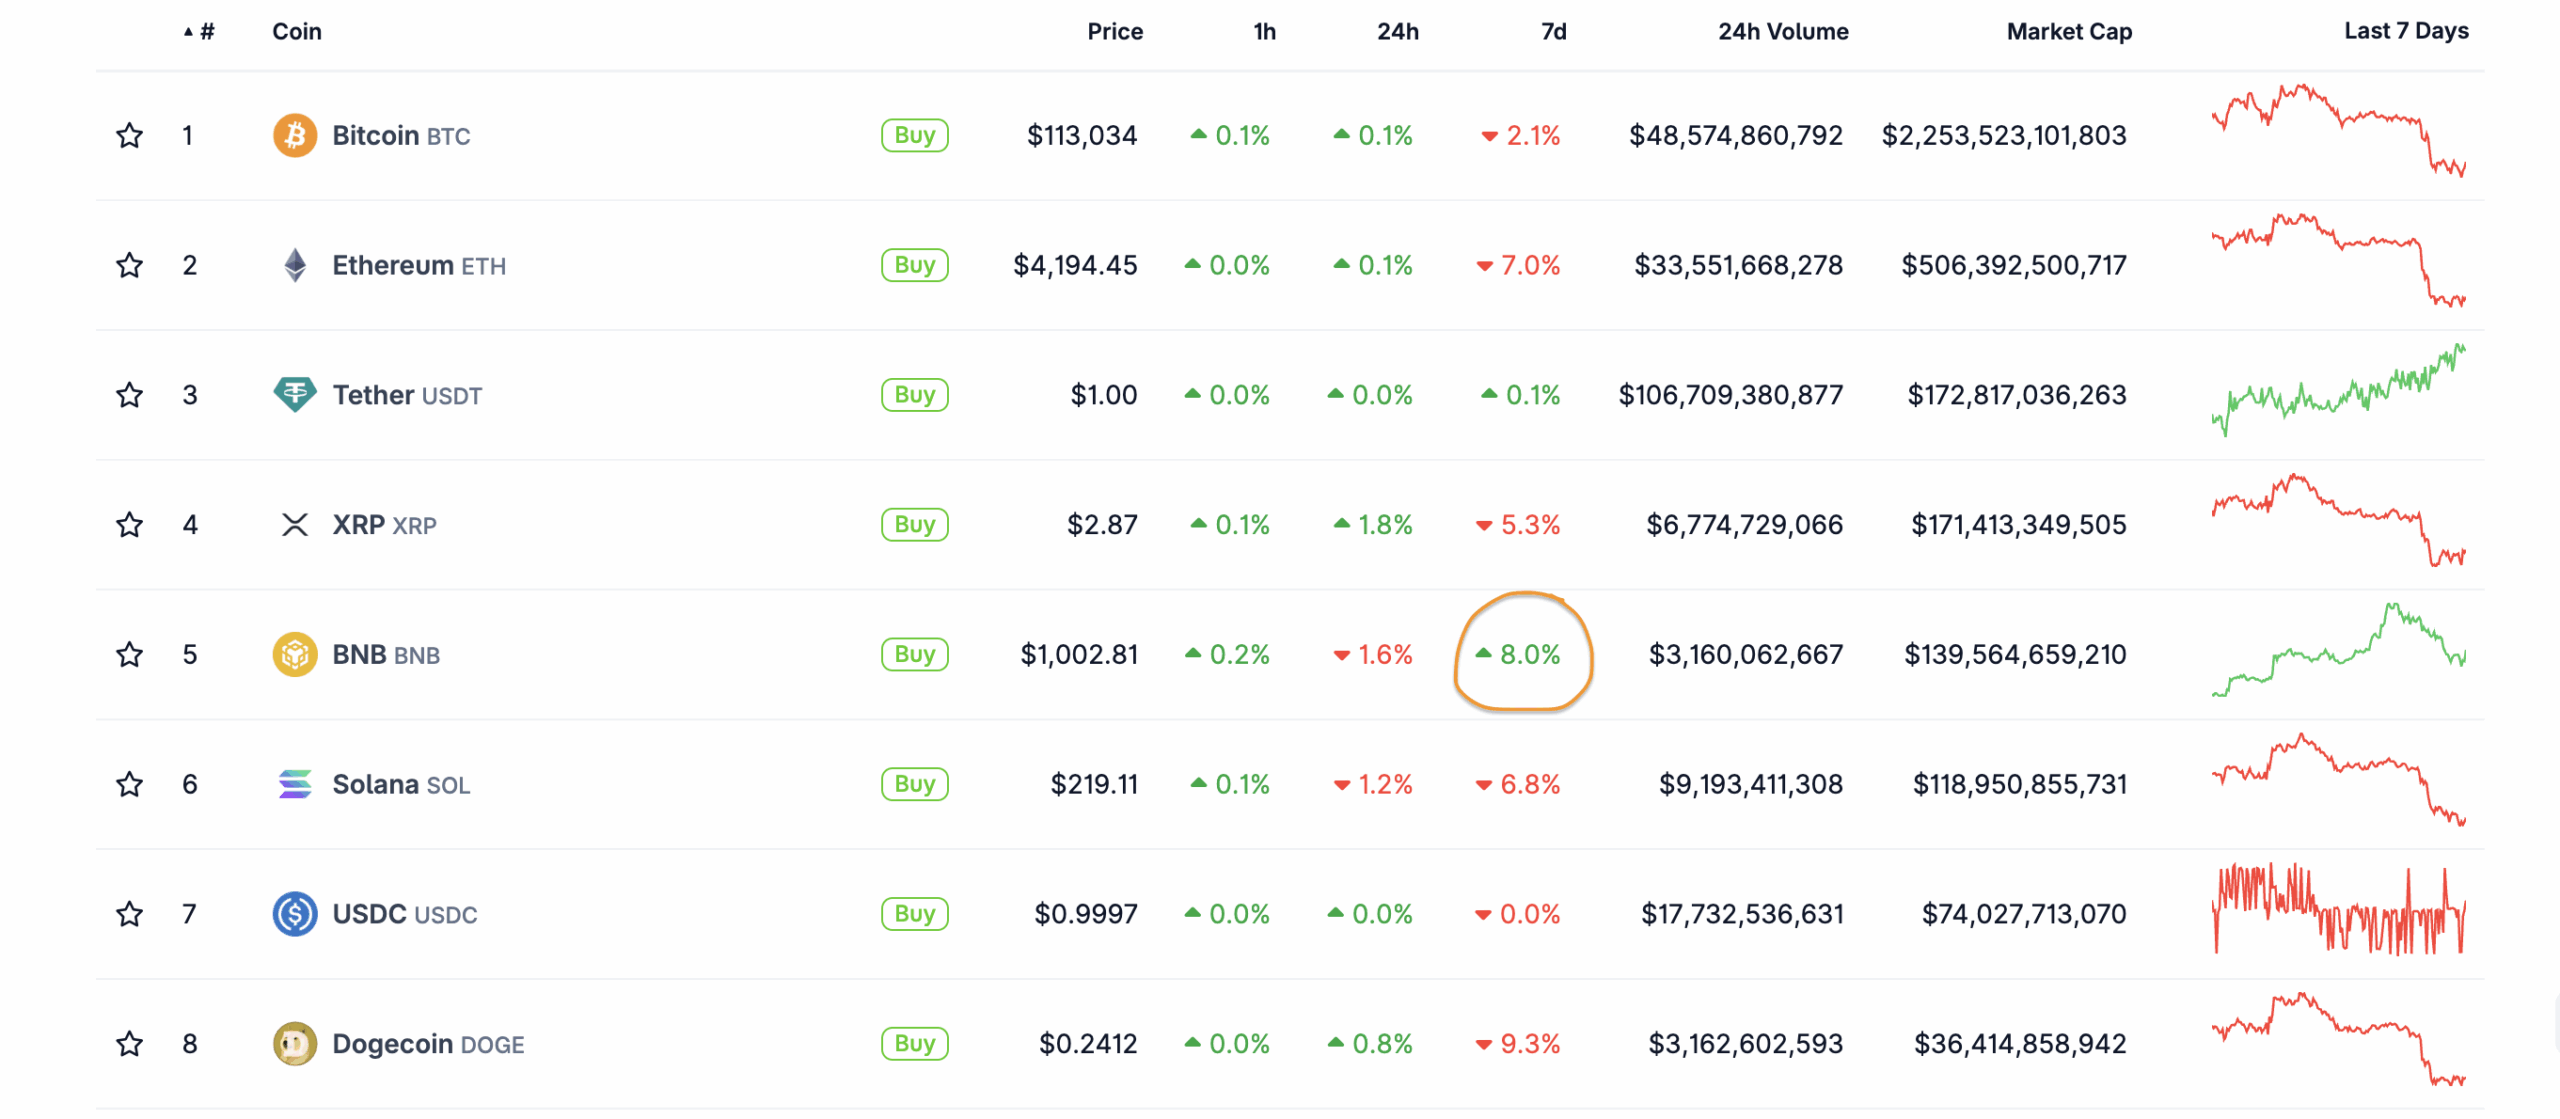
(Source: CoinGecko)
To every builder, believer, and BNB holder: this $1000 milestone is yours. pic.twitter.com/lEnH5Hafms
— Richard Teng (@_RichardTeng) September 18, 2025
With its new ATH in September, BNB is way ahead of ETH and SOL. The Binance team has worked hard over the past 8 years to build a top-tier exchange and a chain with 1.5 million active users – tripled since October last year. Well, price can’t keep going up forever, can it? What comes next? Before moving on, please go over my BNB article from August 2025. I finished that article with these words: “BNB is likely to eventually enter the history books of 4-digit valued coins. The only question is: when?” Well, it took less than a month.
DISCOVER: The 12+ Hottest Crypto Presales to Buy Right Now
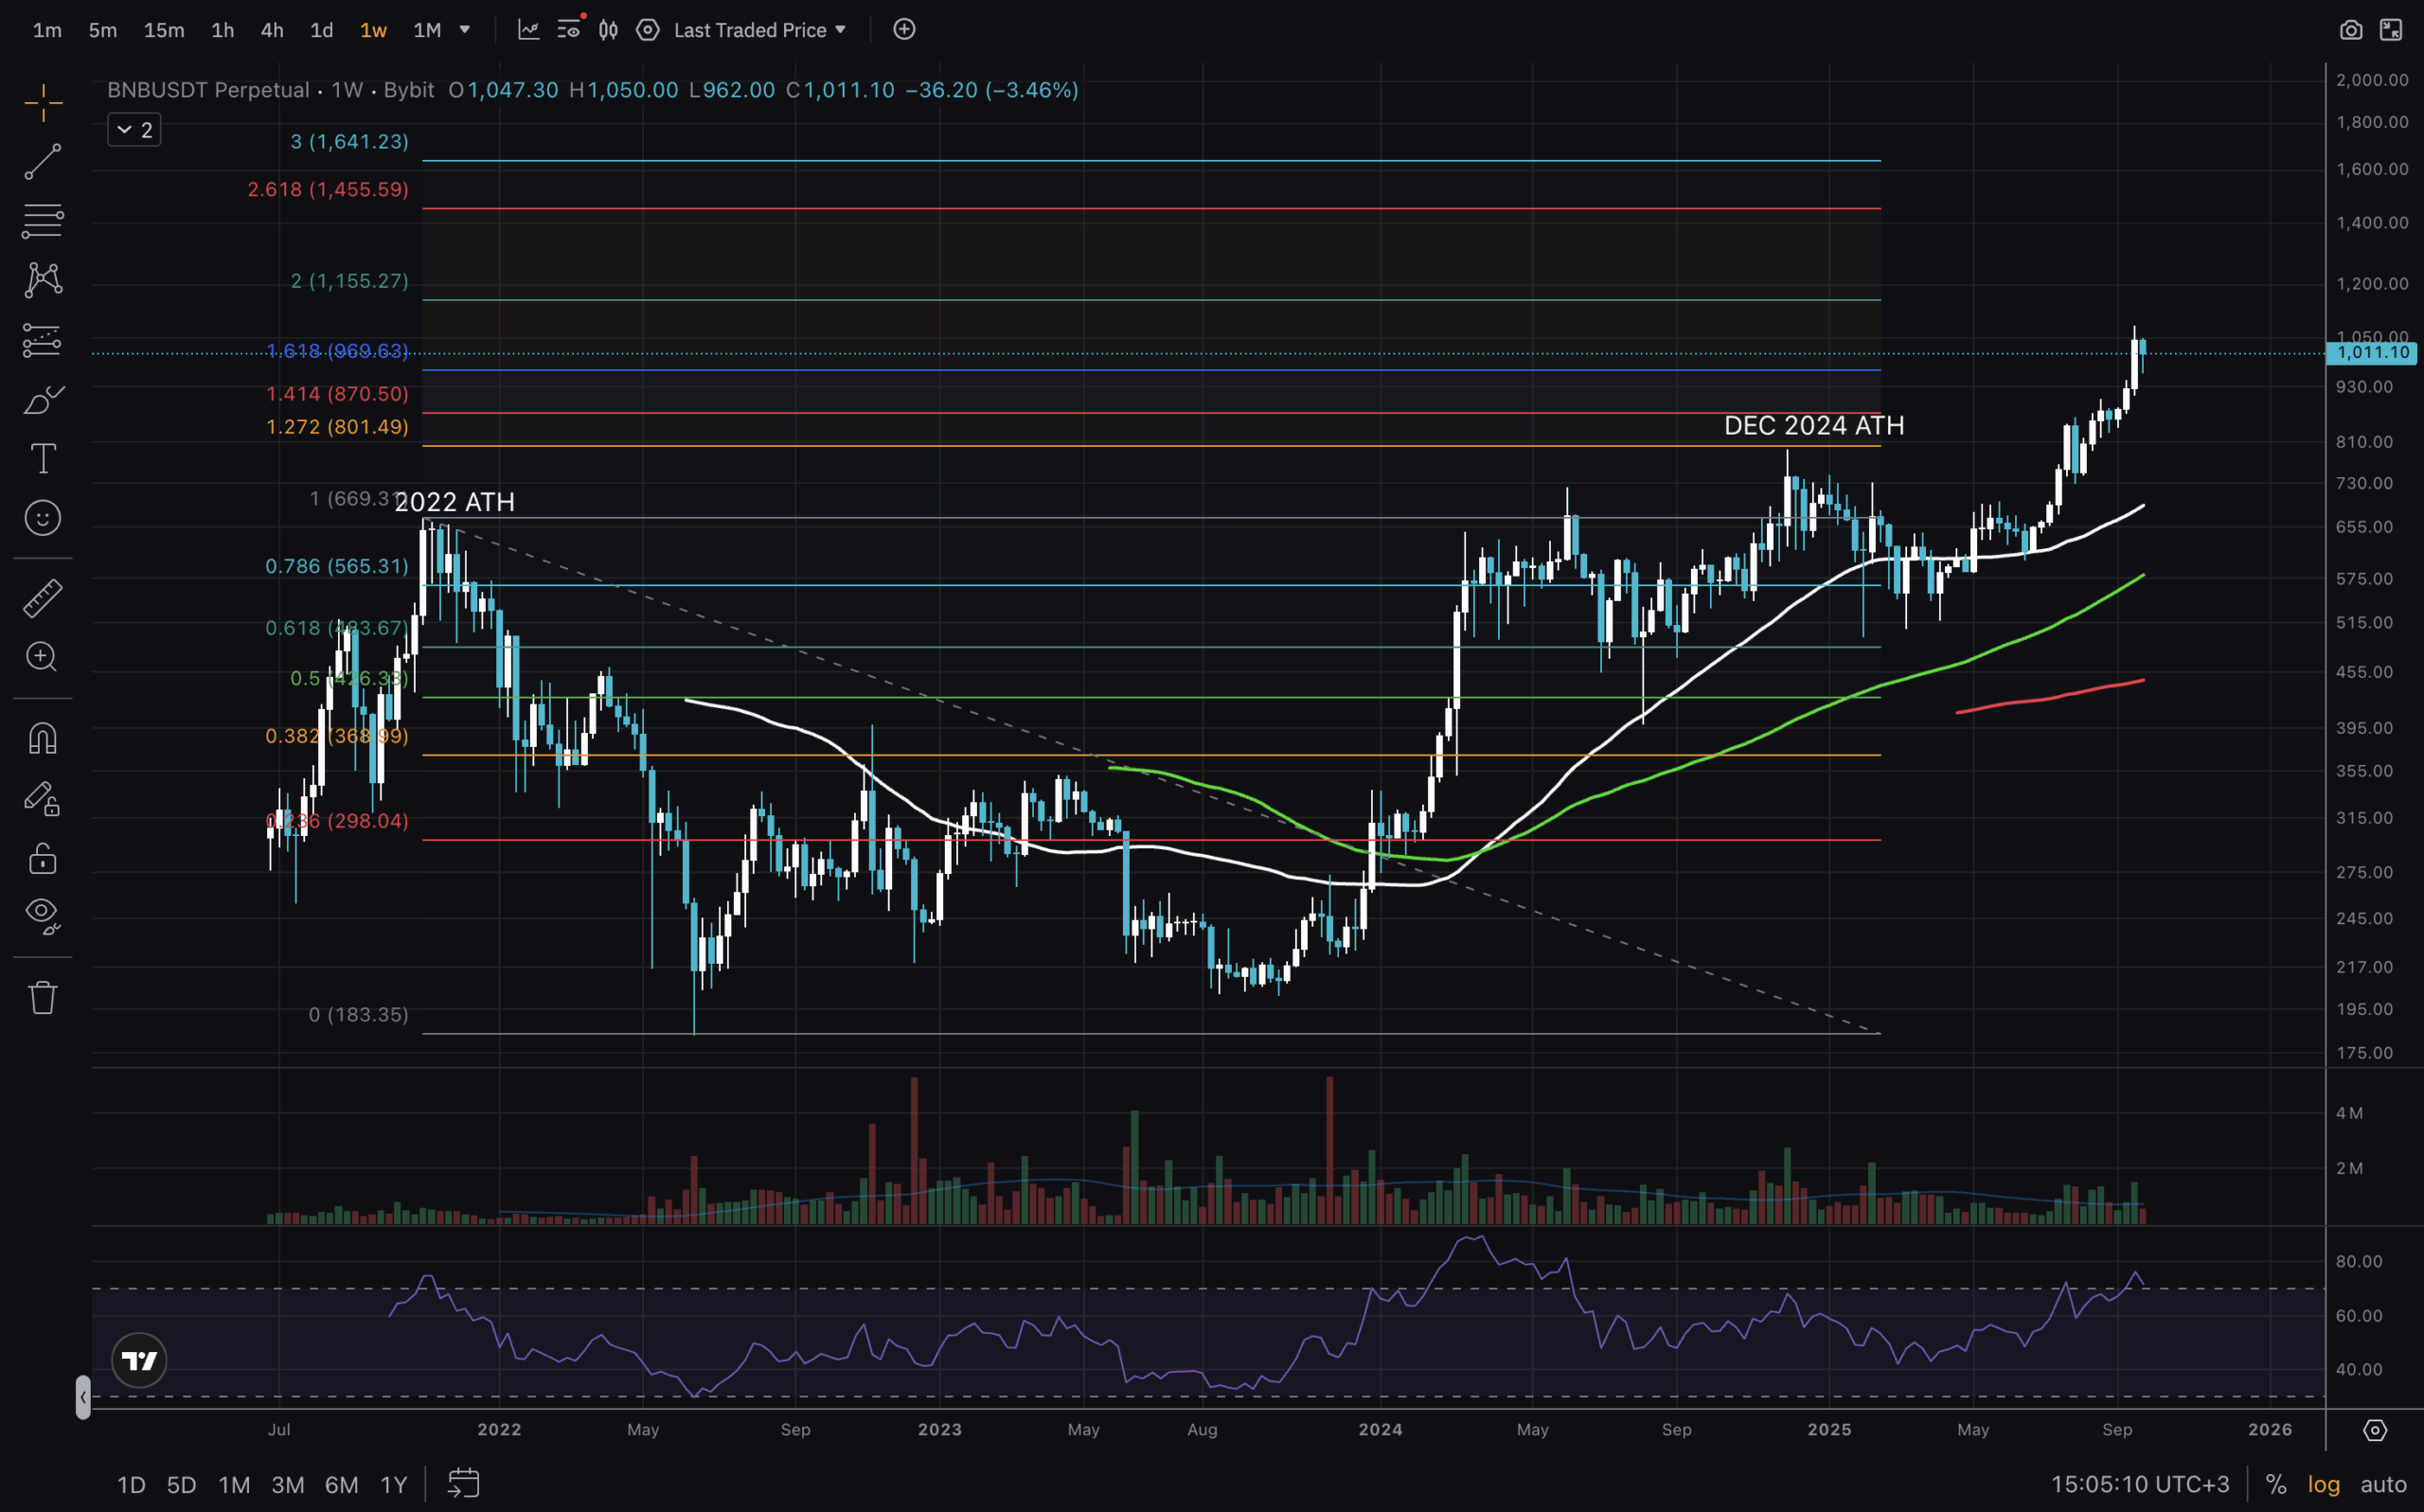
(BNBUSD)
As usual, we want to start our analysis with a high timeframe, and for that purpose, we will use the 1W chart. Since we are asking how long and can this rally continue, I’ve added a Fib Retracement from the 2022 ATH to the 2022 low. The 0.382 and 0 levels essentially established the range of accumulation for BNB.
When the 0.382 level broke, the price went flying towards the $600 region and ranged for a year before breaking to a new ATH of $800 in Dec 2024. A few more months of accumulation followed, and another uptrend began in July of this year. So far it has been roughly 2 months of trending up. RSI is in the overbought area, but as we see in early 2024 – it can stay there for a while.
DISCOVER: Best New Cryptocurrencies to Invest in 2025
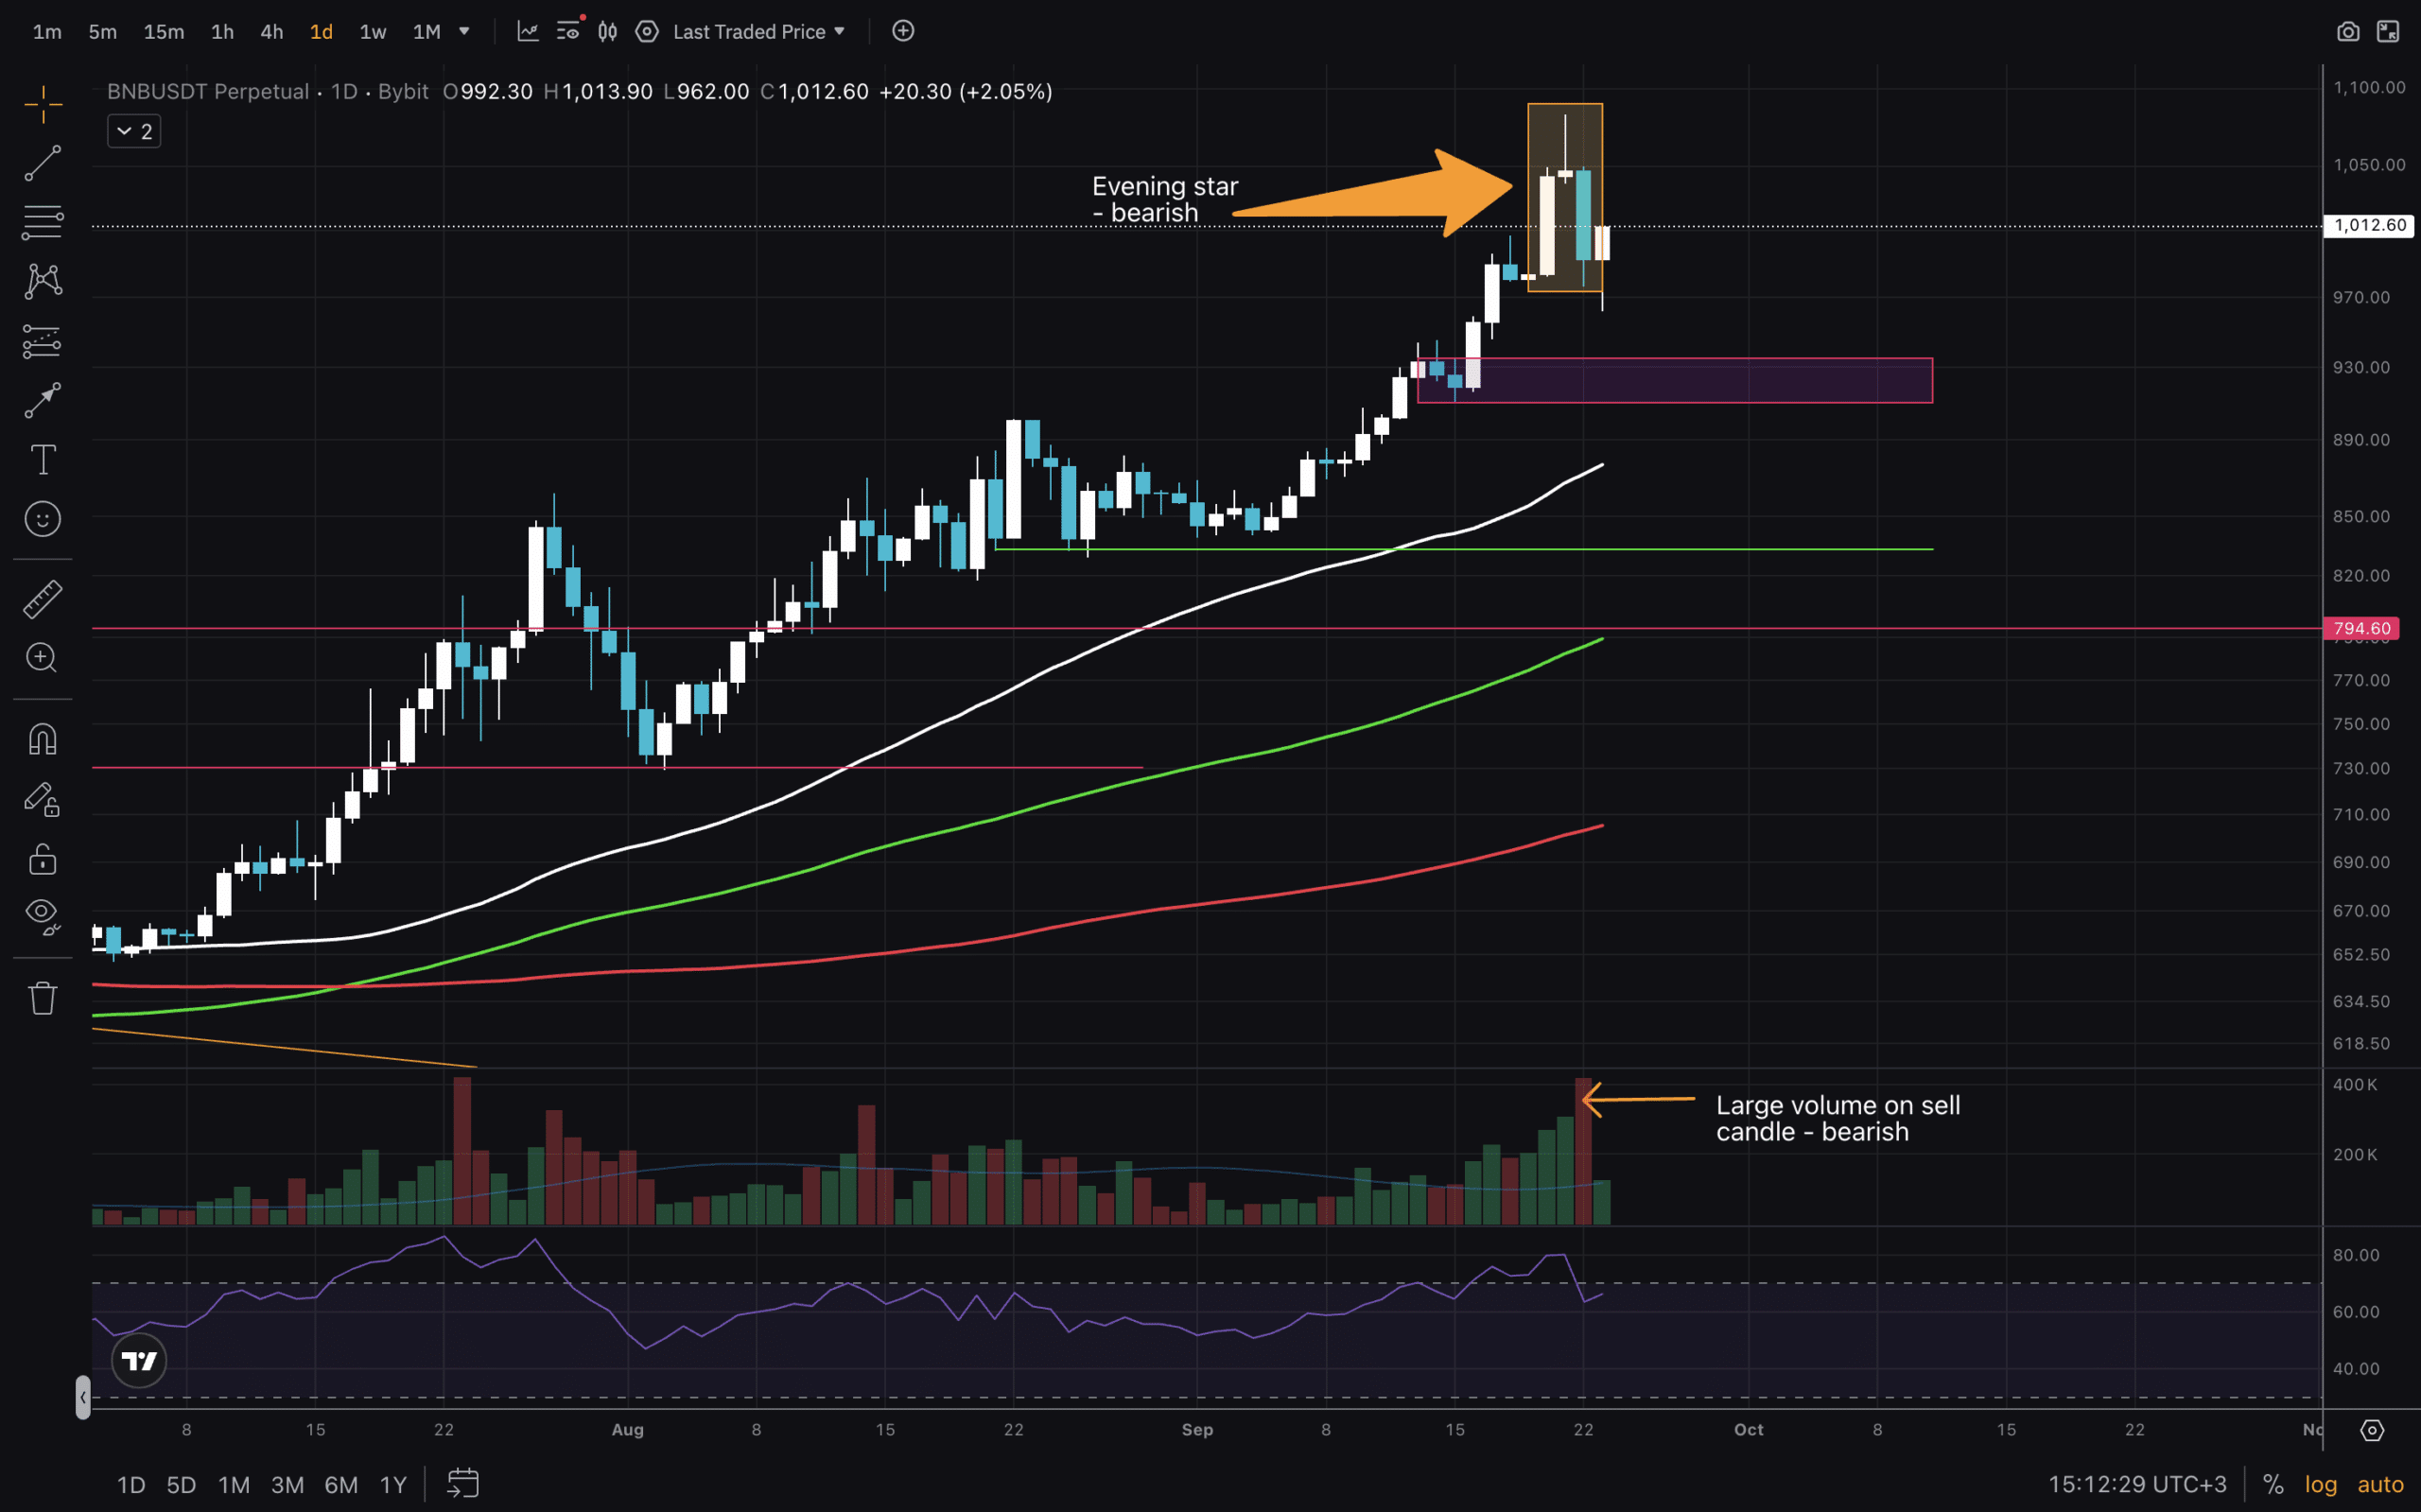
(BNBUSD)
For more information, we are zooming in on the 1D chart. The red horizontal lines are previous highs. The green line I consider to be the latest low, which is to hold if the market structure remains bullish. And lastly, we have the $910 – $945 orderblock – a potential support zone if price is to retrace. From the candlestick patterns, we see an Evening/Shooting star formed with a large volume on the sell candle. That is a signal for caution.
DISCOVER: 20+ Next Crypto to Explode in 2025
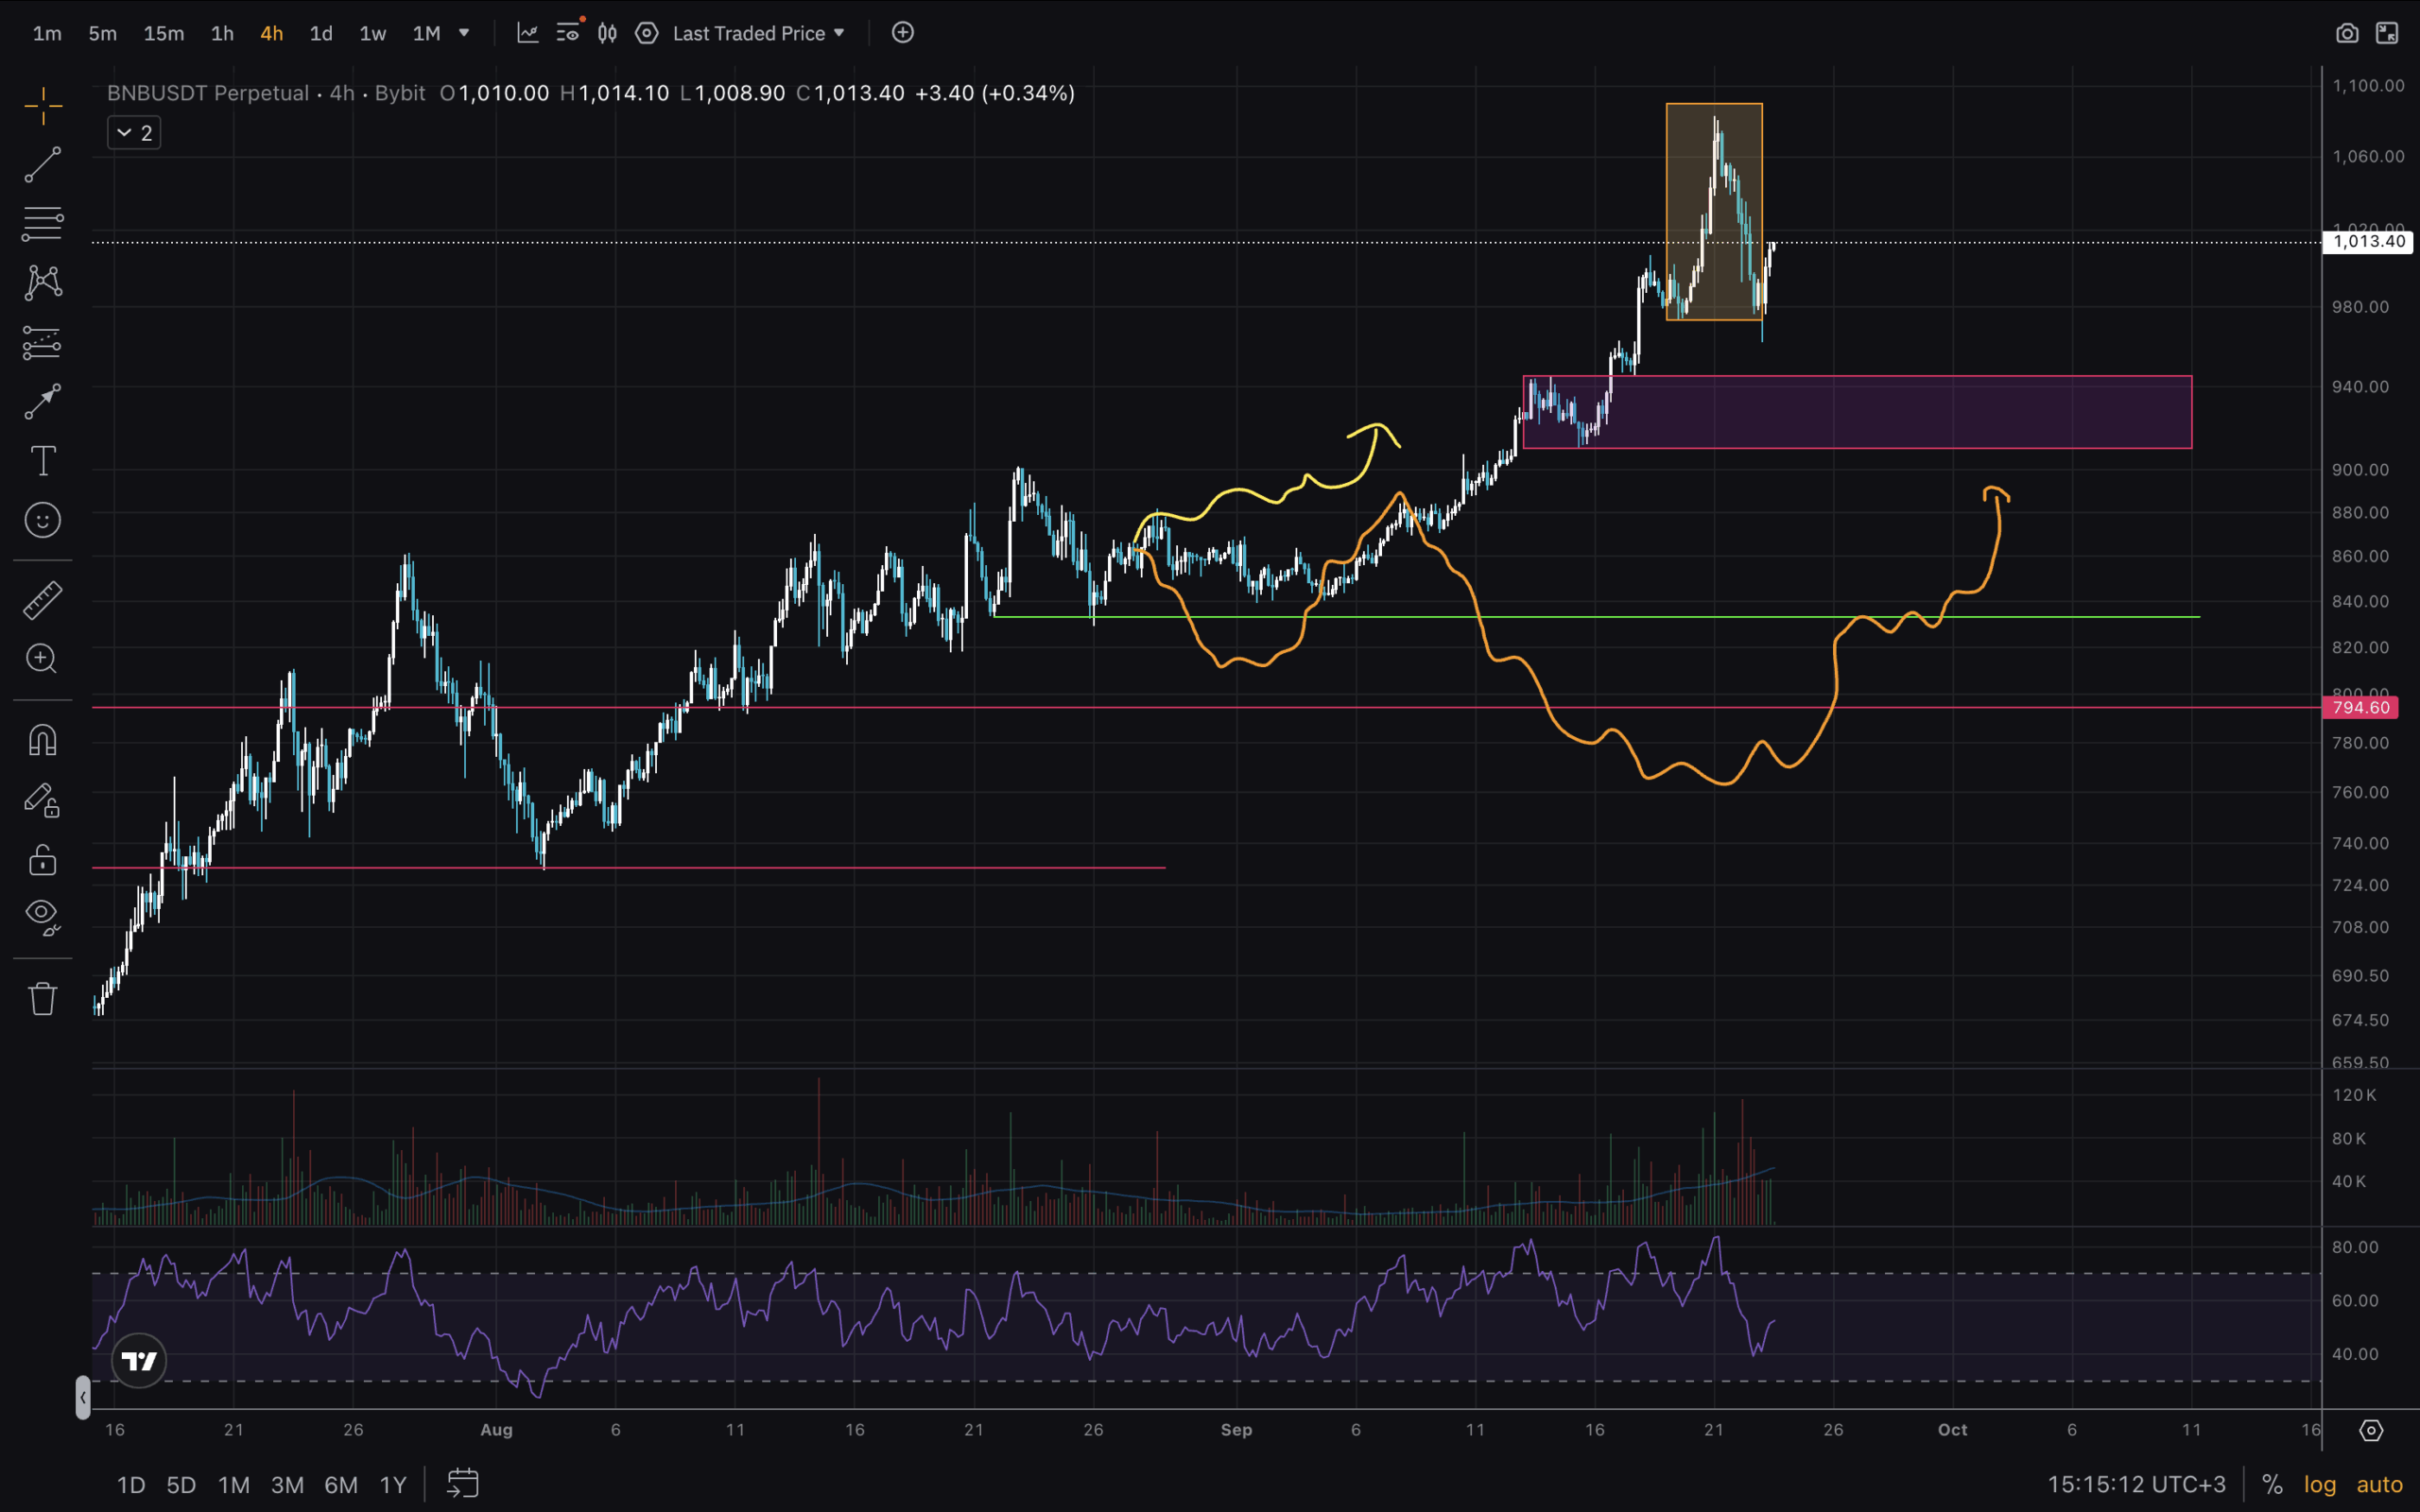
(BNBUSD)
Concluding this analysis on the 4H timeframe, I’ve kept my scenario scribbles from the August article – link available above. It seems like scenario one was fulfilled, which is great! But that means the liquidity resting below $840 is untapped. And with the latest Evening star and high RSI levels on the Weekly and Daily – a retrace might reach that deep before BNB continues on to the higher Fib levels from the Weekly chart.
Happy trading and stay safe out there!
Join The 99Bitcoins News Discord Here For The Latest Market Update
The post BNB is at a Crossroads: Here’s What the Technicals Show appeared first on 99Bitcoins.


