Both major meme-assets traded through high-velocity volatility windows, with Dogecoin rebounding sharply from a heavy-volume flush while Shiba Inu broke key support before staging an aggressive intraday reversal.
Broader crypto markets continued their risk-off rotation as sentiment remained pressured by AI-bubble concerns, $800M in Bitcoin ETF outflows, and tightening liquidity across speculative assets. The weak macro backdrop left meme-coins particularly exposed to volatility shocks.
Despite this, large-holder behavior diverged across DOGE and SHIB. Dogecoin saw an uptick in institutional accumulation following two weeks of heavy whale positioning, while SHIB faced elevated retail-driven selling before buyers stepped in aggressively at intraday lows.
No major token-specific catalysts drove the session’s moves, though traders monitored continued ETF-related discussions and whale positioning trends as key sentiment drivers.
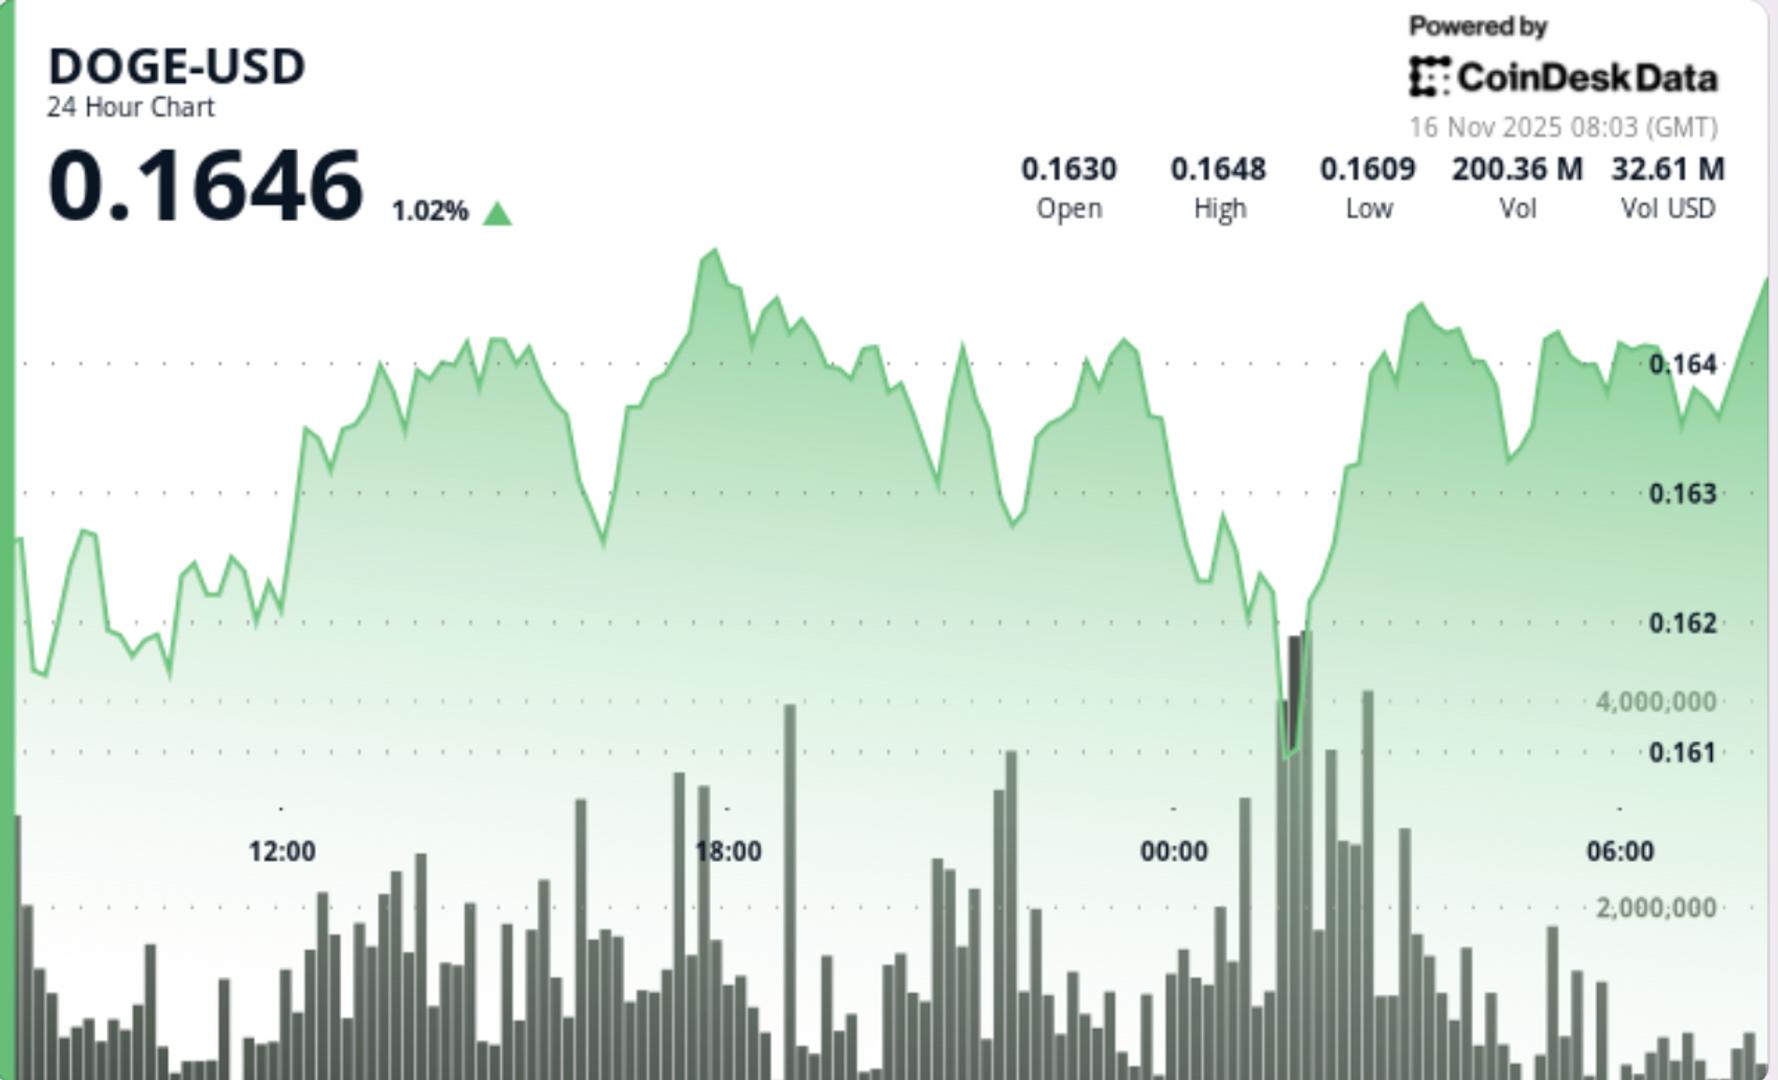
DOGE climbed 3.0% to close at $0.1641, rebounding from a sharp early-session decline that flushed price to $0.1551.
• Volume spiked to 613M during the support test — 186% above the 214M average
• Breakout above $0.1640 established an ascending intraday trendline
• Late-session trading held DOGE in a $0.1638–$0.1643 consolidation band
The rebound produced a clear higher-lows pattern, confirming momentum rotation despite broader market weakness.
SHIB fell 2.0% from $0.000009233 to $0.000009045, breaking daily support at $0.000009240.
• Heavy selling at 08:00 GMT surged to 412.35B tokens — 67% above average
• Price dropped to $0.000008975 before reversing violently
• A V-shaped spike back to $0.000009082 printed on 32.34B hourly volume
The intraday recovery reclaimed short-term resistance at $0.000009060, signaling stability despite the broader downtrend.
Support/Resistance:
• Major support validated at $0.1551
• New support: $0.1638–$0.1640
• Resistance: $0.1650, then $0.1680
Volume:
• 613M peak confirms institutional buying
• Recovery maintained above baseline, signaling sustained demand
Chart Structure:
• Ascending trendline intact
• Higher-lows pattern reinforces bullish momentum
Support/Resistance:
• Strong support: $0.000009020 (triple defense)
• Resistance: $0.000009240, then $0.000009307
Volume:
• Breakdown: 412.35B (+67%)
• Recovery: consistent elevated flows across 02:10–02:12
Chart Structure:
• Daily downtrend intact (lower highs)
• Hourly V-reversal suggests near-term stabilization

