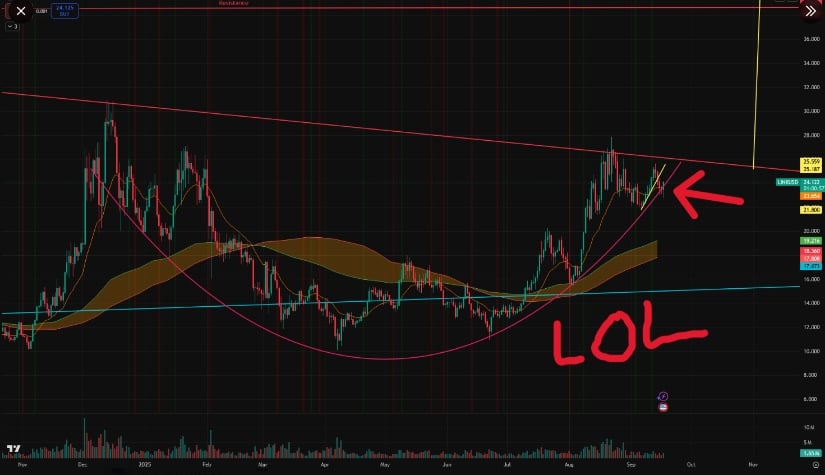
Bubbafox points to a long, rounded base and short handle near the $25 resistance, signaling a possible rally toward $30 if buyers confirm a breakout with rising volume.
The 200-day moving average and mid-term trendline continue to hold, reinforcing bullish momentum above the $21–$22 support zone.
At the same time, LINK trades near $24.03, up 2.35% in 24 hours, with $16.28 billion market cap and $1.23 billion daily volume. Intraday charts show buyers defending $23.0–$23.5 support, while a decisive close above $23.95–$24.89 could extend gains. Sustained volume remains key for validating the breakout and driving further upside.
Chainlink is displaying a large cup-and-handle formation that may be close to completion, according to analyst Bubbafox. The pattern consists of a long, rounded base that forms the cup, followed by a shorter downward consolidation forming the handle. Historical market behavior often associates this pattern with potential upward price movement if the asset clears key resistance levels.
LINKUSDT Chart | Source:x
Bubbafox identifies the $25 zone as a critical level to surpass. The chart shows a long-term descending resistance line derived from previous highs that aligns near this level.
However, a decisive close above this resistance could open a path toward the $30 mark or higher if buying pressure strengthens. The structure suggests that a sustained move above $25 would confirm the pattern and potentially initiate a new upward phase.
Chainlink’s chart also reveals steady technical support. The 200-day moving average and a rising mid-term trendline remain intact, supporting the broader uptrend. Trading volume has maintained stable levels, reflecting consistent market activity around the key support range of $21 to $22. Maintaining this zone is considered essential for the continuation of the cup-and-handle setup.
Additionally, a breakout supported by increasing trading volume would further validate the bullish formation. Bubbafox notes that holding above the $21–$22 range is crucial for buyers to sustain momentum. Otherwise, any decline below these levels could delay the anticipated move, while a successful break above resistance might attract fresh interest from traders targeting a breakout beyond $30.
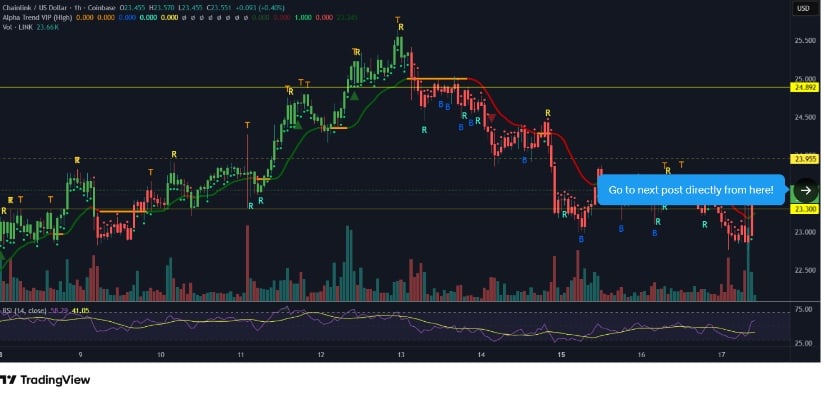
Additional analysis from ShardiB2 focuses on shorter time frames. Shardi B observes that the price action remains capped below $23.95, which now acts as a key short-term resistance. The asset has faced multiple rejections around this pivot, showing sellers’ activity during each attempt to advance.
LINKUSD Chart | Source: x
Support near $23.30 has held firm, with buyers repeatedly defending the area. However, a close below this level may invite deeper pullbacks, while a rebound could lead to a retest of $23.95 and potentially $24.89.
Hourly momentum indicators such as the Relative Strength Index (RSI) fluctuate between 41 and 58, suggesting a neutral to mildly bearish trend without signs of oversold conditions. A strong hourly close above $23.95 would be necessary to restore near-term upside potential.
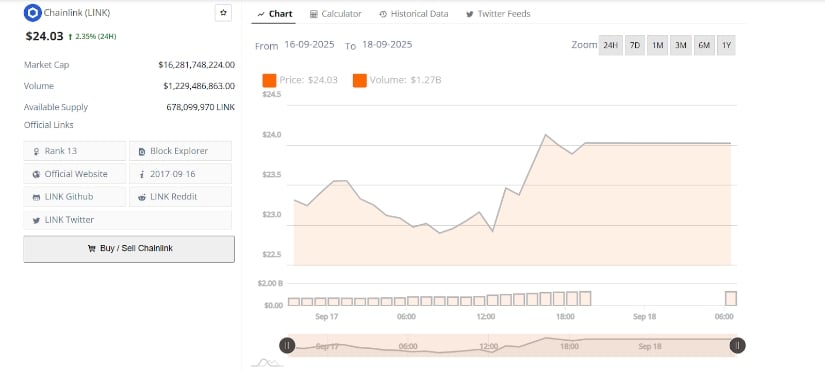
Chainlink price today is at $24 up 2.35% over the past 24 hours. Its market capitalization stands at $16.28 billion, with a daily trading volume of $1.23 billion and a circulating supply of approximately 678 million tokens. During the previous session, the asset moved from $23.1 to $23.5, briefly dipped to $23.0, and then rebounded above $24.0.
LINKUSD 24-Hr Chart | Source: BraveNewCoin
The price breakout above $24.0 coincided with increased trading volume, indicating strong market participation. This activity increases the likelihood of continued attempts to surpass upper resistance levels, with $ 24.50 acting as the next psychological barrier.
The intraday lows near $23.0 provide immediate support and will be closely monitored for potential retests. If buying momentum persists, the path toward $25 and beyond remains a key focus for market participants seeking confirmation of a larger breakout toward the $30 level.