In this Raydium (RAY) price prediction 2025, 2026-2030, we will analyze the price patterns of RAY by using accurate trader-friendly technical analysis indicators and predict the future movement of the cryptocurrency.
TABLE OF CONTENTS |
INTRODUCTION |
|
RAYDIUM (RAY) PRICE PREDICTION 2025 |
|
| RAYDIUM (RAY) PRICE PREDICTION 2026, 2027-2030 |
| CONCLUSION |
| FAQ |
| Current Price | $3.73 | 24 – Hour Price Change | 12.79% Up |
| 24 – Hour Trading Volume | $321.36M |
| Market Cap | $999.92M |
| Circulating Supply | 268.08M RAY | All – Time High | $16.93 (On September 13, 2021) |
| All – Time Low | $0.1343 (On December 30, 2022) |
| TICKER | RAY |
| BLOCKCHAIN | Solana |
| CATEGORY | DeFi (Decentralized Finance) |
| LAUNCHED ON | February 2021 |
| UTILITIES | Governance, Launchpad, Staking and Token Burning |
Raydium (RAY) is a decentralized exchange (DEX) and automated market maker (AMM) built on the Solana blockchain. Known for its high-speed transactions and low fees, Raydium provides liquidity and trading capabilities for the Solana ecosystem, supporting both its native tokens and various assets bridged from other blockchains. Unlike traditional AMMs, Raydium integrates directly with Serum’s on-chain central limit order book, giving it access to Serum’s liquidity and enabling traders to interact with an order book model.
Raydium offers yield farming, allowing users to earn RAY tokens by providing liquidity. It also features “Fusion Pools” for staking and yield optimization. The platform aims to deliver a comprehensive DeFi experience with fast, secure, and scalable options for swapping, trading, and earning within Solana. As Solana’s DeFi space expands, Raydium remains a key player in facilitating seamless and efficient trading and liquidity solutions.
(Source: TradingView)
Raydium (RAY) ranks 83rd on CoinMarketCap in terms of its market capitalization. The overview of the Raydium price prediction for 2025 is explained below with a daily time frame.
RAY/USDT Horizontal Channel Pattern (Source: TradingView)
In the above chart, Raydium (RAY) laid out an Horizontal channel pattern. A horizontal channel or sideways trend has the appearance of a rectangle pattern. It consists of at least four contract points. This is because it needs at least two lows to connect, as well as two highs. Horizontal channels provide a clear and systematic way to trade by providing buy and sell points. The longer the horizontal channel, the stronger the exit movement will be. There is frequently a price on the channel after exit. The exit often occurs at the fourth contact point on one of the horizontal channel’s lines.
At the time of analysis, the Raydium (RAY) price was recorded at $3.73. If the pattern trend continues, then the price of RAY might reach the resistance levels of $2.255, $2.585 and $3.383. If the trend reverses, then the price of RAY may fall to the support levels of $1.958.
The chart given below elucidates the possible resistance and support levels of Raydium (RAY) in 2025.
<embed> https://www.tradingview.com/x/oObTAghp/ <embed>
RAY/USDT Resistance and Support Levels (Source: TradingView)
From the above chart, we can analyze and identify the following as resistance and support levels of Raydium (RAY) for 2025.
| Resistance Level 1 | $3.167 |
| Resistance Level 2 | $4.842 |
| Support Level 1 | $1.953 |
| Support Level 2 | $1.205 |
RAY Resistance & Support Levels
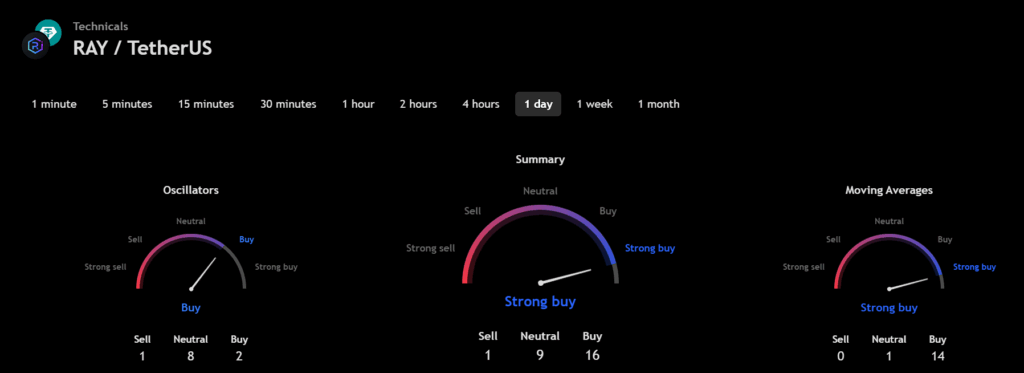
The technical analysis indicators such as Relative Volume (RVOL), Moving Average (MA), and Relative Strength Index (RSI) of Raydium (RAY) are shown in the chart below.
RAY/USDT RVOL, MA, RSI (Source: TradingView)
From the readings on the chart above, we can make the following inferences regarding the current Raydium (RAY) market in 2025.
| INDICATOR | PURPOSE | READING | INFERENCE |
| 50-Day Moving Average (50MA) | Nature of the current trend by comparing the average price over 50 days | 50 MA = $2.705Price = $2.165 (50MA > Price) | Bullish/Uptrend |
| Relative Strength Index (RSI) | Magnitude of price change;Analyzing oversold & overbought conditions | 41.797 <30 = Oversold 50-70 = Neutral>70 = Overbought | Nearly Oversold |
| Relative Volume (RVOL) | Asset’s trading volume in relation to its recent average volumes | Below cutoff line | Weak volume |
In the below chart, we analyze the strength and volatility of Raydium (RAY) using the following technical analysis indicators — Average Directional Index (ADX) and Relative Volatility Index (RVI).
RAY/USDT ADX, RVI (Source: TradingView)
From the readings on the chart above, we can make the following inferences regarding the price momentum of Raydium (RAY).
| INDICATOR | PURPOSE | READING | INFERENCE |
| Average Directional Index (ADX) | Strength of the trend momentum | 26.850 | Strong Trend |
| Relative Volatility Index (RVI) | Volatility over a specific period | 49.97 <50 = Low >50 = High | Low volatility |
Let us now compare the price movements of Raydium (RAY) with that of Bitcoin (BTC), and Ethereum (ETH).
BTC Vs ETH Vs RAY Price Comparison (Source: TradingView)
From the above chart, we can interpret that RAY’s price action is similar to that of BTC and ETH. That is, when the price of BTC and ETH increases or decreases, the price of RAY also increases or decreases respectively.
With the help of the aforementioned technical analysis indicators and trend patterns, let us predict the price of Raydium (RAY) between 2026, 2027, 2028, 2029, and 2030.
| Year | Bullish Price | Bearish Price |
| Raydium (RAY) Price Prediction 2026 | $12 | $0.9 |
| Raydium (RAY) Price Prediction 2027 | $14 | $0.8 |
| Raydium (RAY) Price Prediction 2028 | $16 | $0.7 |
| Raydium (RAY) Price Prediction 2029 | $18 | $0.6 |
| Raydium (RAY) Price Prediction 2030 | $20 | $0.5 |
If Raydium (RAY) establishes itself as a good investment in 2025, this year will favor the cryptocurrency. In conclusion, the bullish Raydium (RAY) price prediction for 2025 is $4.842. Comparatively, if unfavorable sentiment is triggered, the bearish Raydium (RAY) price prediction for 2025 is $1.205.
If the market momentum and investors’ sentiment positively elevate, then Raydium (RAY) might hit $10. Furthermore, with future upgrades and advancements in the Raydium ecosystem, RAY might surpass its current all-time high (ATH) of $16.93 and mark its new ATH.
Raydium (RAY) is a decentralized exchange (DEX) and automated market maker (AMM) built on the Solana blockchain.
Traders can trade Raydium (RAY) on the following cryptocurrency exchanges such as Binance, Coinbase, KuCoin, Gate.io, Kraken, OKX, Bybit, and Huobi
With the ongoing developments and upgrades within the Raydium platform, Raydium (RAY) has a high possibility of reaching its ATH soon.
Raydium (RAY) hit its current all-time high (ATH) of $16.93 on September 13, 2021.
According to CoinMarketCap, RAY hit its all-time low (ATL) of $0.1343 on December 30, 2022.
If Raydium (RAY) becomes one of the active cryptocurrencies that majorly maintain a bullish trend, it might rally to hit $10 soon.
Raydium (RAY) price might reach $ 12 by 2026.
Raydium (RAY) price might reach $14 by 2027.
Raydium (RAY) price might reach $16 by 2028.
Raydium (RAY) price might reach $18 by 2029.
Top Crypto Predictions
Helium (HNT) Price Prediction
Mantle (MNT) Price Prediction
XRP (XRP) Price Prediction
Disclaimer: The opinion expressed in this chart is solely the author’s. It does not represent any investment advice. TheNewsCrypto team encourages all to do their own research before investing.


