In this THORChain (RUNE) price prediction 2025, 2026-2030, we will analyze the price patterns of RUNE by using accurate trader-friendly technical analysis indicators and predict the future movement of the cryptocurrency.
TABLE OF CONTENTS |
INTRODUCTION |
|
THORCHAIN (RUNE) PRICE PREDICTION 2025 |
|
| THORCHAIN (RUNE) PRICE PREDICTION 2026, 2027-2030 |
| CONCLUSION |
| FAQ |
| Current Price | $1.26 | 24 – Hour Price Change | 2.41% Up |
| 24 – Hour Trading Volume | $126.82M |
| Market Cap | $445.08M |
| Circulating Supply | 351.34M RUNE | All – Time High | $21.26 (On May 19, 2021) |
| All – Time Low | $0.007939 (On Sep 28, 2019 ) |
| TICKER | RUNE |
| BLOCKCHAIN | THORChain |
| CATEGORY | Decentralized Exchange |
| LAUNCHED ON | 2019 |
| UTILITIES | Governance, security, gas fees & rewards |
THORChain (RUNE) is the native utility token of the THORChain platform. THORChain is a cross-chain decentralized liquidity protocol. The project was born out of a hackathon that commenced in 2018. Its native token, RUNE was initially launched as a BEP-2 token and later transitioned to an ERC-20 token in 2019.
THORChain is built on Cosmos SDK and Tendermint protocol and uses a proof-of-stake (PoS) consensus mechanism. It also includes its native decentralized exchange (DEX) that enables users to swap tokens across different blockchains. THORChain DEX aids the inclusion of automated market makers (AMMs).
Further, THORChain (RUNE) is used in staking, trading, security, and governance and is provided as a reward to users.
(Source: TradingView)
THORChain (RUNE) ranks 130th on CoinMarketCap in terms of its market capitalization. The overview of the THORChain price prediction for 2025 is explained below with a daily time frame.
In the above chart, THORChain (RUNE) laid out an Horizontal Channel pattern also known as the sideways trend. In general, the horizontal channel is formed during the price consolidation. In this pattern, the upper trendline, the line which connects the highs, and the lower trendline, the line which connects the lows, run horizontally parallel and the price action is contained within it.
A horizontal channel is often regarded as one of the suitable patterns for timing the market as the buying and selling points are in consolidation.
At the time of analysis, THORChain (RUNE) ‘s price was $1.26. If the pattern trend continues, then the price of RUNE might reach the resistance levels of $1.257, $1.601, and $2.608. If the trend reverses, then the price of RUNE may fall to the support levels of $1.380, and $0.991.
The chart given below elucidates the possible resistance and support levels of THORChain (RUNE) in 2025.
From the above chart, we can analyze and identify the following as the resistance and support levels of THORChain (RUNE) for 2025.
| Resistance Level 1 | $1.327 |
| Resistance Level 2 | $1.501 |
| Support Level 1 | $1.142 |
| Support Level 2 | $0.995 |
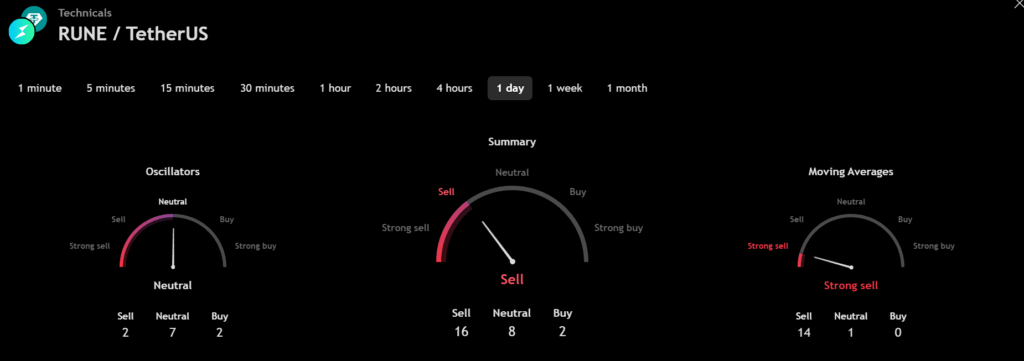
The technical analysis indicators such as Relative Volume (RVOL), Moving Average (MA), and Relative Strength Index (RSI) of THORChain (RUNE) are shown in the chart below.
From the readings on the chart above, we can make the following inferences regarding the current THORChain (RUNE) market in 2025.
| INDICATOR | PURPOSE | READING | INFERENCE |
| 50-Day Moving Average (50MA) | Nature of the current trend by comparing the average price over 50 days | 50 MA = $1.255 Price = $1.152 (50MA > Price) | Bearish/Downtrend |
| Relative Strength Index (RSI) | Magnitude of price change;Analyzing oversold & overbought conditions | 42.736 <30 = Oversold 50-70 = Neutral >70 = Overbought | Nearly Oversold |
| Relative Volume (RVOL) | Asset’s trading volume in relation to its recent average volumes | Below cutoff line | Weak Volume |
In the below chart, we analyze the strength and volatility of THORChain (RUNE) using the following technical analysis indicators — Average Directional Index (ADX) and Relative Volatility Index (RVI).
From the readings on the chart above, we can make the following inferences regarding the price momentum of THORChain (RUNE).
| INDICATOR | PURPOSE | READING | INFERENCE |
| Average Directional Index (ADX) | Strength of the trend momentum | 13.415 | Weak Trend |
| Relative Volatility Index (RVI) | Volatility over a specific period | 37.35 <50 = Low >50 = High | Low Volatility |
Let us now compare the price movements of THORChain (RUNE) with that of Bitcoin (BTC), and Ethereum (ETH).
From the above chart, we can interpret that the price action of RUNE is similar to that of BTC and ETH. That is, when the price of BTC and ETH increases or decreases, the price of RUNE also increases or decreases respectively.
With the help of the aforementioned technical analysis indicators and trend patterns, let us predict the price of THORChain (RUNE) between 2026, 2027, 2028, 2029, and 2030.
| Year | Bullish Price | Bearish Price |
| THORChain (RUNE) Price Prediction 2026 | $12 | $0.6 |
| THORChain (RUNE) Price Prediction 2027 | $14 | $0.5 |
| THORChain (RUNE) Price Prediction 2028 | $16 | $0.4 |
| THORChain (RUNE) Price Prediction 2029 | $18 | $0.3 |
| THORChain (RUNE) Price Prediction 2030 | $20 | $0.2 |
If THORChain (RUNE) establishes itself as a good investment in 2025, this year would be favorable to the cryptocurrency. In conclusion, the bullish THORChain (RUNE) price prediction for 2025 is $1.501. Comparatively, the bearish THORChain (RUNE) price prediction for 2025 is $0.995.
If there is a positive elevation in the market momentum and investors’ sentiment, then THORChain (RUNE) might hit $10. Furthermore, with future upgrades and advancements in the THORChain ecosystem, RUNE might surpass its current all-time high (ATH) of $21.26 and mark its new ATH.
THORChain (RUNE) is the native utility token of the THORChain platform. THORChain is a cross-chain decentralized liquidity protocol.
THORChain (RUNE) has been listed on many crypto exchanges which include Binance, Bybit, Bitrue, BingX, and BitMart.
With the ongoing developments and upgrades within the THORChain platform, THORChain (RUNE) has a high possibility of reaching its ATH soon.
THORChain (RUNE) hit its current all-time high (ATH) of $21.26 on May 19, 2021.
According to CoinMarketCap, RUNE hit its all-time low (ATL) of $0.007939 on Sep 27, 2019.
If THORChain (RUNE) becomes one of the active cryptocurrencies that majorly maintain a bullish trend, it might rally to hit $10 soon.
THORChain (RUNE) price might reach $12 by 2026.
THORChain (RUNE) price might reach $14 by 2027.
THORChain (RUNE) price might reach $16 by 2028.
THORChain (RUNE) price might reach $18 by 2029.
Top Crypto Predictions
Cronos (CRO) Price Prediction
DeXe (DEXE) Price Prediction
Neo (NEO) Price Prediction
Disclaimer: The opinion expressed in this article is solely the author’s. It does not represent any investment advice. TheNewsCrypto team encourages all to do their own research before investing.


