Cardano ADA holds $0.246 support as bulls target a rebound to $0.255, with $0.262 next after a TD Sequential buy signal.
Cardano ADA is trading near a key support area as bulls look for a short-term rebound.
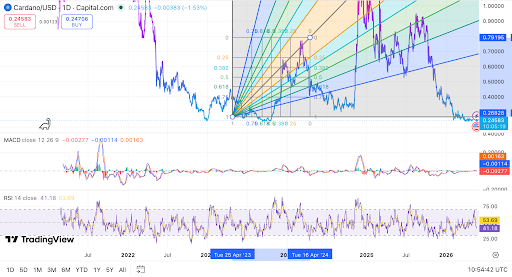
The daily chart shows ADA near $0.246, while traders watch whether buyers can defend that level into the close. If support holds, the next upside levels sit at $0.255 and $0.262.
Cardano is testing an important support zone near $0.246 after a recent pullback.
The level is now central to the short-term Cardano price forecast, as a daily close below it could weaken the rebound setup.
Market analysts are focused on whether ADA can stay above the $0.24 to $0.25 range.
This area has acted as a key price zone before, and it now serves as the main base for buyers.
The current setup comes after a 15% correction over the past ten days.
That move followed a TD Sequential sell signal on May 10, which warned of weaker short-term momentum.
The same indicator is now showing a buy signal on the daily chart. Traders often use the TD Sequential to find possible turning points after extended moves.
The latest TD Sequential buy signal suggests that selling pressure may be slowing. It does not confirm a trend change alone, but it can support a short-term recovery attempt.
One market analyst stated, “Cardano ADA bulls target $0.255 rebound if $0.246 support holds firm.” That level is now the first area to watch if buyers step in.
Cardano $ADA could be primed for a rebound!
The TD Sequential indicator has been highly accurate at anticipating shifts in Cardano’s short-term momentum. On May 10, it flashed a sell signal that anticipated the 15% price correction we’ve seen over the last ten days.
Now that… https://t.co/1D5bULWwxs pic.twitter.com/m4ZKlQgpMh
— Ali Charts (@alicharts) May 21, 2026
A move above $0.255 could bring $0.262 into focus. That would mark the next near-term resistance level, and it may decide whether momentum improves further.
However, the broader structure remains weak. ADA has formed lower highs and lower lows since its prior rally above the $1 area. This keeps the wider trend under pressure.
The chart also shows prices below earlier recovery zones from 2024 and 2025. Because of that, a bounce may still be a relief move unless larger resistance levels break.
Read Also:
Cardano Delegate Backs High Assurance Proposal With 66.68 Million ADA Yes Vote
The MACD remains slightly bearish, as the MACD line is still below the signal line. Yet both lines are close to the zero level, so momentum is not strong.
This type of setup can appear during consolidation. A bullish MACD crossover would support a rebound, but price confirmation is still needed.
The RSI is near 41, while its moving average is around 54. This shows that ADA is not deeply oversold, but buying strength is still limited.
For momentum to improve, the RSI would need to move back above the 50 to 55 area. A rejection there could show that sellers remain active.
If ADA clears $0.262, traders may then watch the $0.268 to $0.270 zone. A stronger move could place $0.30 and $0.35 back on the chart.
The larger resistance levels remain near $0.40, $0.50, $0.60, and $0.79. Until ADA reclaims those zones, the long-term Cardano price trend stays under pressure.
For now, the Cardano ADA price setup depends on the $0.246 daily support. Holding that level keeps the $0.255 rebound target active.
The post Cardano ADA Bulls Target $0.255 Rebound If $0.246 Support Holds Firm appeared first on Live Bitcoin News.

